A complete pedigree-based graph workflow for rare candidate variant analysis
- Charles Markello1,
- Charles Huang2,
- Alex Rodriguez2,
- Andrew Carroll3,
- Pi-Chuan Chang3,
- Jordan Eizenga1,
- Thomas Markello2,
- David Haussler1,4 and
- Benedict Paten1
- 1UC Santa Cruz Genomics Institute, Santa Cruz, California 95060, USA;
- 2Undiagnosed Diseases Program, National Human Genome Research Institute, National Institutes of Health, Bethesda, Maryland 20894, USA;
- 3Google Incorporated, Mountain View, California 94043, USA;
- 4Howard Hughes Medical Institute, University of California, Santa Cruz, California 95064, USA
Abstract
Methods that use a linear genome reference for genome sequencing data analysis are reference-biased. In the field of clinical genetics for rare diseases, a resulting reduction in genotyping accuracy in some regions has likely prevented the resolution of some cases. Pangenome graphs embed population variation into a reference structure. Although pangenome graphs have helped to reduce reference mapping bias, further performance improvements are possible. We introduce VG-Pedigree, a pedigree-aware workflow based on the pangenome-mapping tool of Giraffe and the variant calling tool DeepTrio using a specially trained model for Giraffe-based alignments. We demonstrate mapping and variant calling improvements in both single-nucleotide variants (SNVs) and insertion and deletion (indel) variants over those produced by alignments created using BWA-MEM to a linear-reference and Giraffe mapping to a pangenome graph containing data from the 1000 Genomes Project. We have also adapted and upgraded deleterious-variant (DV) detecting methods and programs into a streamlined workflow. We used these workflows in combination to detect small lists of candidate DVs among 15 family quartets and quintets of the Undiagnosed Diseases Program (UDP). All candidate DVs that were previously diagnosed using the Mendelian models covered by the previously published methods were recapitulated by these workflows. The results of these experiments indicate that a slightly greater absolute count of DVs are detected in the proband population than in their matched unaffected siblings.
Recent advances in genome sequencing technology are improving the accuracy of detecting genetic variants (Wenger et al. 2019). However, the use of a single genome reference for read alignment and variant calling still presents a problem. A sequence mapping algorithm best aligns sequences to a reference when those sequences are present in the reference. Where a sample's genome deviates significantly enough from the reference, reads will fail to map properly (Sherman et al. 2019). This reference bias can be reduced using pangenome graphs. Pangenome graphs represent multiple genomes as a series of variants (Garrison et al. 2018). These graphs are further enhanced by incorporating haplotype information that is available in phased genotype data sets. This haplotype information is embedded in a haplotype index (Sirén et al. 2021). In previous work, we have found that mapping error, in both simulation and real-data experiments, is reduced by using population variant data in pangenome graph references (Garrison et al. 2018; Sirén et al. 2021).
Parent-child trios provide evidence of sequence transmission between generations. This helps to identify which variants in the child occurred as de novo mutations, because these variants will generally be absent in the parents. This information also helps to determine phasing orientation of heterozygotes in the child which can aid in detecting compound-heterozygous candidate DVs. In typical clinical diagnostics, in particular for the case of rare diseases, parental genomes are sequenced to help improve the chances of successful clinical diagnosis of a proband (Clark et al. 2018).
The Undiagnosed Disease Program (UDP) of the National Human Genome Research Institute (NHGRI) is charged with diagnosing previously undiagnosed individuals and discovering new variants of clinical significance (Gahl and Tifft 2011; Gahl et al. 2012, 2015, 2016; Splinter et al. 2018). In 2009, the UDP began examining cases that have remained undiagnosed after previous exhaustive clinical examination. One part of their process involved sequencing the genomes of patients, including some that included parents, an affected proband, and one or more unaffected siblings. Since the beginning of the UDP, they have seen more than 500 different disorders and achieved a diagnostic success rate of over 30%, including the discovery of new disorders (Gu et al. 2019). Most of the pediatric cases examined by the UDP over the past 10 yr have already had negative diagnostic results from clinical exomes. The UDP applies further technologies, including whole-genome sequencing, RNA sequencing, and SNP-chip analysis to more completely explore nonexonic and intergenic regions in an attempt to solve negative exome cases (Gu et al. 2019). One of the more difficult tasks of gene discovery is the detection of variants in highly polymorphic, repetitive, and incompletely represented regions of the genome, exactly where pangenome graphs can potentially extend accuracy and precision.
We first describe VG-Pedigree, a software workflow for mapping and variant calling high-throughput sequencing data. The workflow leverages pedigrees in genome graphs and uses machine-learning for variant calling. Intermediary results from VG-Pedigree are subsequently used to identify candidate deleterious variants by using a significantly upgraded, fully automated single-stage implementation of the UDP candidate analysis workflow (Gu et al. 2019). These upgrades include better software portability and usability, change to the GRCh38 reference, use of better population data sets, and newer deleterious predictors than those used in the previous version. The final upgrade was the addition of a new software module to detect and quantify large scale mosaicism. This unified workflow was designed to run from machine output FASTA sequence data to a final short candidate list, but it is modular. The first part of VG-Pedigree produces an intermediate set of BAM files and a jointly called VCF file. The candidate analysis in the second part could be run using any set of genome BAM formatted files plus a joint-called VCF formatted pedigree data set.
Our aim is to demonstrate sequencing accuracy improvements and utility in applications regarding the investigation of rare sample-specific variants in individuals. We set out to evaluate this workflow by examining its mapping performance and variant calling accuracy in simulated and real benchmark data sets. We conclude by evaluating its ability to recapitulate differences in candidate variant lists between sets of matched proband and sibling pairs from a cohort of UDP quartets.
Results
Overview of VG-Pedigree
VG-Pedigree goes through a number of stages before final variant calling (Fig. 1A). First, the set of short reads in the parent-parent-child trio of the pedigree are mapped to a pangenome graph reference based on the 1000 Genomes Project data set, termed 1000GP, using VG Giraffe, and variants are then called using DeepTrio (Fig. 1B; The 1000 Genomes Project Consortium 2015; Sirén et al. 2021). Next, variants in 1000 Genomes Project haplotypes that appear missing in the DeepTrio-called variants are imputed. The purpose of this is to fill in common variants that were possibly missed by the variant callers in order to facilitate the phasing of more complete haploblocks. The resulting variant file is phased using both alignment and pedigree information (Fig. 1C). A parental graph reference is then constructed using only the parental genotypes from the joint-called VCF file (Fig. 1D). A haplotype index of this graph reference for VG Giraffe is generated from the phased genotypes of the parental samples. Once this graph is constructed, the proband and siblings reads are remapped to this new parental graph reference and variants are re-called using the new mappings (Fig. 1B). Finally, the newly called variants of the child and sibling samples are joint-called with the old parental variants to form the final joint-called pedigree VCF.
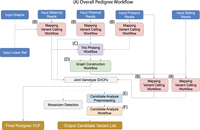
Toil-VG-Pedigree workflow. Dotted lines indicate optional pathways in the workflow. (A) Overall workflow diagram. (B) Single sample alignment and variant calling workflow. (C) Trio joint-genotyping and phasing workflow. (D) Parental graph construction workflow. (E) Workflow for preprocessing and annotation of pedigree variants required for candidate analysis. (F) The candidate analysis workflow.
The candidate analysis workflow takes as input the set of alignments and variant calls from VG-Pedigree and outputs a final set of candidate DVs for the proband. This is done through a series of filters and annotations. First, SnpEff is used to annotate the type and function of variants within the joint-called pedigree VCF file (Cingolani et al. 2012). The deleteriousness of these variants is predicted using the Combined Annotation Dependent Depletion (CADD) software tool (Fig. 1E; Rentzsch et al. 2021). Next, a series of filtration and analysis methods are applied to the annotated variants, and the workflow outputs a set of candidate DVs for the proband (Fig. 1F). The methods applied in the candidate analysis workflow are an implementation of the methods described in Gu et al. (2019). In this paper, we present enhancements to the methods and software of the candidate analysis workflow. An additional module of the analysis workflow has also been developed which automatically detects the presence and type of mosaicism in the designated proband. These methods and improvements together provide a more complete and accurate data set from which to discover rare variants that are causal to genetic diseases over the previous iteration.
We evaluated performance of this workflow based on four main metrics. First, we evaluated the ability of the workflow to accurately align reads to the correct position in a genome. Second, we assessed the accuracy of variant calls based on those alignments. Third, we looked at the ability of the analysis workflow to capture DVs in the proband population versus the unaffected sibling population. Finally, we examined the runtime and costs of running this workflow using a commercial cloud environment.
Mapping evaluation
Mapping was evaluated with both simulated and real sequencing data. The former considers measures of mapping reads with a known position. This was done by simulating reads from haplotypes whose corresponding path locations in the graph are known, so that we could identify when a read was mapped to the correct location on the graph. We simulated reads by first constructing sample graphs using benchmark sample variation data and then generated paired-ended reads using error models and pair distance distributions based on real-read data. We also made sure to only simulate reads from benchmark samples that were not contained within the pangenome references used in the graph mapping methods. During evaluation, simulated reads mapped to the linear references were injected to graph reference space for comparison with graph mappers (see Supplemental Methods S1). Figure 2 illustrates the performance of 10 million read pairs that are simulated from the Genome-in-a-Bottle (GIAB) HG002 version 4.2.1 high-confidence variant sets (Olson et al. 2021). We also examined stratified performance across regions of interest using 100 million reads simulated from the GIAB high-confidence regions. These regions were all defined by GIAB (Krusche et al. 2019): low-complexity regions that comprise regions of low sequence variability; low-mappability regions that are made up of duplicated and paralogous sequence; the Major Histocompatibility Complex (MHC, also known as HLA) which is known for maintaining a high density of variation; 1000GP variant regions excluded from the GIAB sample (1000GP-excluded); and, specifically for HG002, the complex medically relevant genes (CMRG) included in Wagner et al. (2021a).
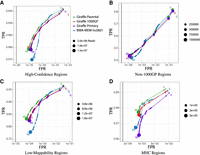
Mapping performance of 100 million read pairs simulated from HG002 high-confidence data sets. Four different alignments are compared across four different regions and ROC curves are plotted with a log-scaled false positive rate on the x-axis and a linear-scaled true positive rate on the y-axis with the mapping quality as the discriminating factor. Green curves represent graph alignments against the parental graph reference constructed from HG003 and HG004 Illumina read graph alignments. Red curves represent alignments against the 1000GP graph reference. Purple curves represent alignments to the primary GRCh38 linear graph reference. Blue curves represent linear alignments against the hs38d1 reference using BWA-MEM. (A) Alignments in GIAB v4.2.1 confident regions (from 10 million simulated read set). (B) Alignments in non-1000GP confident regions (from 10 million simulated Illumina read set). (C) Alignments in GIAB v4.2.1 low-mappability regions (from 100 million simulated Illumina read set). (D) Alignments in GIAB v4.2.1 MHC regions (from 100 million simulated Illumina read set).
All conditions evaluated consist of the combination of a mapper and a reference (see Supplemental Methods S2). The Giraffe-Parent condition used VG Giraffe (Sirén et al. 2021) to align reads to the parental graph reference as produced by the workflow up to graph construction (Fig. 1D). The Giraffe-1000GP condition used VG Giraffe to align reads to the pangenome reference. The Giraffe-Primary condition used VG Giraffe to align reads to a linear graph reference as produced using only the hs38d1 reference with no variation, and the BWA-MEM-hs38d1 condition used BWA-MEM (Li 2013) to align reads to the hs38d1 human reference genome.
Figure 2 shows the receiver operating characteristic curves (ROCs) of each tested mapper in all high-confidence regions, 1000GP-excluded regions, low-mappability regions, and MHC regions. The curves are stratified by mapping quality (MAPQ). In each evaluated region, Giraffe-Parent produced the highest F1, both for reads with MAPQ60 and across all reads. When looking at 1000GP-excluded variants within stratified regions, Giraffe-Parent produced the highest total F1 across low-complexity regions (Supplemental Fig. S1), low-mappability regions (Supplemental Fig. S2), MHC regions (Supplemental Fig. S3), and CMRG regions (Supplemental Fig. S4).
For all GIAB high-confidence regions, Giraffe-Parent gave the most accurate alignments relative to the other examined mappers. Giraffe-Parent also achieved the highest total of correctly mapped reads in all but the CMRG regions, the highest total of reads mapped at MAPQ60 in low-mappability MHC and CMRG regions, and the highest average percent identity between aligned reads and the reference sequence across all regions (Supplemental Table S1). In the high-confidence 1000GP-excluded regions of the HG002 sample, Giraffe-Parent achieved the highest proportion of correctly mapped reads, MAPQ60 reads, and average sequence identity (Supplemental Table S2). Giraffe-Parent also produced the highest proportions of perfectly aligned and gaplessly aligned reads, and the lowest proportion of soft-clipping reads across all examined confident (Supplemental Table S3) and 1000GP-excluded regions (Supplemental Table S4).
Variant calling evaluation
In addition to examining the mapping performance of the workflow, we measured the accuracy of variants called in each workflow. Here, we use the version 4.2.1 release of the HG001, HG002, and HG005 truth-set benchmarks as published by GIAB (Zook 2020; Wagner et al. 2021a,b). The RealTimeGenomics vcfeval tool (Cleary et al. 2015) and Illumina's hap.py haplotype aware-variant comparison tool (Krusche et al. 2019) were used when comparing the results of variants called using alignments of real reads to various combinations of mappers and references. The mappers and references used include VG Giraffe against the parental graph (Giraffe-Parent), which is the method used by VG-Pedigree, and, for comparison, VG Giraffe against the 1000GP graph (termed Giraffe-1000GP), BWA-MEM against the linear hs38d1 reference (BWA-MEM-hs38d1), and Illumina's Dragen platform version 3.7.5 (Miller et al. 2015; Krusche et al. 2019; Olson et al. 2021) against the linear hs38d1 reference (Dragen-hs38d1) (see Supplemental Methods S3, S4). We tested our VG-Pedigree pipeline using DeepTrio version 1.1.0 with trained child and parent models for variant calling comparison in HG001. Training used the Ashkenazi (HG002, HG003, HG004), and Han Chinese (HG005, HG006, HG007) trio alignments using the Giraffe-1000GP method for model training (see Supplemental Methods S4.2). The DeepTrio-called variants achieve the highest accuracy (F1: 0.9976) using Giraffe-Parent (Table 1A,B). This represents a total variant error (false positive and false negative) reduction of 4844 variants between Giraffe-Parent and BWA-MEM-hs38d1 relative to an error reduction of 2925 variants between Giraffe-1000GP and BWA-MEM-hs38d1. In the 1000GP-excluded variants, the Giraffe-Parent accuracy (F1: 0.9748) outperforms Giraffe-1000GP (F1: 0.9717) by a greater margin than Giraffe-1000GP outperforms BWA-MEM-hs38d1 (F1: 0.9691). This reflects an error reduction of 3210 variants between Giraffe-Parent and BWA-MEM-hs38d1 relative to an error reduction of 1481 variants between Giraffe-1000GP and BWA-MEM-hs38d1.
vcfeval HG001 DeepTrio and DeepVariant Performance; vcfeval performance of the graph-based and linear-based pipelines with respect to HG001 GIAB v4.2.1 truth variant call sets stratified by (A) DeepTrio on all HG001 regions, (B) DeepTrio on HG001 regions excluding 1000GP variants, (C) DeepVariant on all HG001 regions, and (D) DeepVariant on HG001 regions excluding 1000GP variants
We then assessed HG002 and HG005 using the same training method for the model used in evaluating HG001. The models were retrained with Giraffe-1000GP-aligned read data for all trio samples except with Chromosome 20 completely held out for validation purposes. Supplemental Figure S10, C and D and Supplemental Table S5 show the results of training for HG002 and Supplemental Figure S11, C and D and Supplemental Table S6 for HG005 results. The total number of errors in Chromosome 20 reduced from 1070 to 1051 (1.78%) and from 1130 to 909 (19.56%) variants for HG002 and HG005, respectively.
We also tested Giraffe-Parent using the default DeepTrio version 1.1.0 models, which were not trained with Giraffe alignments. We found that, in using the HG005 and HG002 trios, Giraffe-Parent or Giraffe-1000GP with the default DeepTrio models outperforms the results achieved using standard BWA-MEM (Supplemental Table S7A,B). The same performance gains are observed for Giraffe-Parent in more difficult regions except in highly repetitive regions for both HG002 and HG005 samples (Supplemental Tables S8, S9).
ROC curves for DeepTrio calls stratified by genotype quality also show performance gains. Figure 3, A and B shows the ROC curves between the graph-based and linear-based alignment methods in HG001 for all confident regions and 1000GP-excluded variants, respectively. Supplemental Figures S10, A and B and S11, A and B illustrate performance in the same regions but for the HG002 and HG005 samples using the default DeepTrio models, respectively.
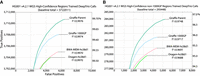
ROC curves of DeepTrio variant calling performance of the graph-based and linear-based pipelines with respect to HG001 GIAB v4.2.1 truth variant call sets stratified by (A) HG001 high-confidence whole genome regions using trained DeepTrio models, and (B) HG001 high-confidence whole genome regions excluding 1000GP variants using trained DeepTrio models.
We also examined the difficult regions of the genome more deeply for the HG001, HG002, and HG005 GIAB samples using the sample-specific stratification (Wagner et al. 2021a,b). Giraffe-Parent outperformed the other examined methods in the sample-specific complex variants containing single-heterozygous SNPs and indels or compound-heterozygous SNPs except for regions that contain compound-heterozygous variants where at least one of the variants is an indel. In those regions, either BWA-MEM-hs38d1 or Dragen-hs38d1 achieved the highest F1 scores relative to the Giraffe methods (Supplemental Tables S10–S12).
Comparing to DeepVariant
To compare the mapping performance with non-trio-based calling methods, we ran the DeepVariant single sample genotyper on the same alignments (Poplin et al. 2018a). This evaluation assesses gains in variant calling accuracy brought by mapping to a graph containing the subject's parental information (Giraffe-Parent) versus simply mapping to a linear reference or a population based pangenome graph (Giraffe-1000GP).
During evaluation of DeepVariant calls, like in our DeepTrio evaluations, we focused on using models that were not trained with pangenome graph alignments of the samples used in evaluation. For HG001 alignments, a trained DeepVariant model was used in evaluating HG001 whole genome results. This model was trained using just the Giraffe-1000GP-aligned HG002 and HG004 sample reads. For evaluations of DeepVariant calls on HG002 and HG005 alignments, the default models of DeepVariant version 1.1.0 were used. In HG001, the Giraffe-Parent method achieves the highest accuracy (F1: 0.9974) representing a total variant error reduction of 9727 variants between Giraffe-Parent and BWA-MEM-hs38d1 relative to an error reduction of 3945 variants between Giraffe-1000GP and BWA-MEM-hs38d1 (Table 1C).
Illumina Dragen calling
We additionally tested using Illumina's Dragen platform version 3.7.5 variant caller in place of DeepTrio (Miller et al. 2015). The Dragen variant caller uses an algorithm similar to that of GATK HaplotypeCaller and, like DeepVariant, does not use the parental read mappings (Poplin et al. 2018b).
We used Dragen to call variants against the Giraffe pangenome and BWA-MEM linear reference mappings. Once again, Giraffe-Parent produced the most accurate variant calls for HG002 and HG005. Giraffe-Parent produced the highest F1 score (0.9965) in all confident regions for HG002 (Supplemental Table S13). This is in contrast with the F1 performance of Giraffe-1000GP (0.9953) and BWA-MEM-hs38d1 (0.9940). Total error is reduced by 18,754 variants between Giraffe-Parent and BWA-MEM-hs38d1 relative to an error reduction of 9995 between Giraffe-1000GP and BWA-MEM-hs38d1. For HG005, Giraffe-Parent produced the highest F1 score (0.9958) in all confident regions (Supplemental Table S14). This is in contrast with Giraffe-1000GP (F1: 0.9944) and BWA-MEM-hs38d1 (F1: 0.9931). Total error is reduced by 20,724 variants between Giraffe-Parent and BWA-MEM-hs38d1 relative to an error reduction of 10,489 between Giraffe-1000GP and BWA-MEM-hs38d1.
Breaking down the analysis to SNPs and indels reveals the same trend. The Giraffe-Parent produced the highest F1 scores in HG002 in all examined regions except for the CMRG genes, where Dragen-hs38d1 achieves a higher accuracy in indels (F1: 0.959108) relative to Giraffe-Parent (F1: 0.958785) (Supplemental Tables S15–S20). Similar statistics are observed in HG005, where Giraffe-Parent alignments produce the highest F1 in all SNPs and indels across all confident regions (Supplemental Tables S21–S25).
Illumina Dragen graph comparison
Illumina's Dragen platform version 3.7.5 has also implemented a graph-based mapper. To compare, we also examined the performance of the Dragen graph implementation for mapping and variant calling (termed Dragen-Graph-hs38d1) (Miller et al. 2015). The Giraffe-Parent with the DeepTrio calling method outperformed Dragen-Graph-hs38d1 across all confident regions of HG001, HG002, and HG005 GIAB benchmarks (Supplemental Table S26).
Candidate analysis evaluation
As a quality-control procedure, we investigated the workflow's ability to identify DVs that are relevant to clinical disorders. We ran the workflow on nuclear pedigrees of at least four individuals in size. Out of the UDP set of such 50 cohorts with identified candidate variants, a set of 15 cohorts was randomly chosen. The 15 cohorts include 15 probands and 22 unaffected siblings comprising 18 females and 19 males. Ten out of 12 of the UDP probands from these cohorts that have a known genetic diagnosis had their causal variants recapitulated by this workflow. The list of Mendelian models detected include homozygous recessive, de novo, hemizygous, X-linked, mitochondrial, and compound-heterozygous genotypes. Of the 12 examined probands that have a diagnosis attributed to a CLIA-validated variant, five were identified with de novo dominant nonsynonymous changes in an exonic region, two had a de novo dominant frameshift in an exonic region, two had compound-heterozygous variants where both were nonsynonymous changes in exonic regions, and one had a compound-heterozygous variant with a nonsynonymous change in an exon and a change in an intronic/splice-site region. Of the two that were missed, one had a large structural variant deletion which the candidate analysis workflow was not designed to detect. The other was a male with a de novo variant on the X Chromosome with a low CADD score that did not pass the workflow's default CADD threshold. Supplemental Table S27 shows the number and type of candidate variants detected by the workflow for all 37 individuals.
In addition, we compared the number and type of clinically relevant variants that are identified between the affected proband population and their matched unaffected sibling population to indirectly evaluate the pipeline's ability to identify DVs. This analysis runs in two steps. First, for each family, the affected offspring are set as the proband in the workflow and the unaffected offspring are set as the unaffected siblings. Then, for the second step, for each family, the unaffected offspring are set as the proband and the affected offspring are set as the unaffected siblings. Finally, the set of candidate DVs from the probands in the first step are compared against the set of candidate DVs from their matched unaffected siblings in the second step.
There is an expected baseline load of rare deleterious variants that all individuals inherit due to de novo mutation and inefficient selection against segregating variants (Henn et al. 2015). Figure 4A shows the distribution between these two populations in the 15 pedigree cohort sample set. Figure 4B shows the distribution of differences in the candidate DVs between the matched proband and siblings. X-linked recessive candidate DVs were excluded from both populations in order to improve comparability between male and female samples. Compound-heterozygous candidate pairs and candidate alleles that occupy the same locus are also counted as one candidate for the purposes of this comparison. The number of candidate DVs in the proband population is significantly different from their matched unaffected siblings set of candidate DVs (Wilcoxon signed-rank test P-value = 0.03). Given a large enough sample set, we might expect the median number of rare deleterious variants in the proband population to be slightly different from the median number of rare deleterious variants in the unaffected sibling population. Due to two factors, the probands level of genetic burden is hypothesized to be slightly greater than that of their unaffected siblings: all probands in this analysis currently show phenotypic expression of their disease, and the unaffected siblings are of similar age.
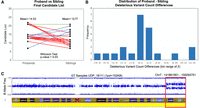
Proband-sibling pairwise candidate analysis results on 15 nuclear families of at least quartet in size, comprising a population of 15 probands and 22 siblings. Plot A shows the average number of candidate variants between the probands and sibling populations. Seventeen red lines (four overlapping) represent proband-sibling pairs where the proband has more DVs than their matched sibling, five blue lines (one overlapping) represent probands that have less DVs than their matched sibling, and one green line, where probands have the same number of DVs as their matched sibling. The proband population holds an average of 14.53 DVs whereas the sibling population has an average of 12.77 DVs. A one-tailed Wilcoxon signed-rank test of the hypothesis that the probands have greater numbers of DVs than their matched siblings produced a P-value of 0.0333. (B) The distribution of proband-sibling DV list size differences. (C) A mosaic region identified by the workflow (red box) overlaid with the SNP-chip B allele frequency plot for a UDP sample.
In addition, we ran the workflow on four undiagnosed cases that have previously shown a negative or inconclusive clinical exome and negative commercial genome assay results. From these samples, we have produced a number of candidate DVs. Of the four cases, two have candidate DVs that match their phenotypic profile and are being examined for clinical function; the other two cases are undergoing further investigation. One of the two cases had an identified mosaic region on Chromosome 7 detected by the candidate analysis workflow (Fig. 4C). Concurrently, we ran the analysis on the HG001(NA12878), HG002, HG005 probands and, as expected, did not detect any signs of mosaicism. Supplemental Tables S28 and S29 show the number and type of candidate variants detected by the workflow.
Runtime evaluation
The workflows examined are runnable on the Terra platform (Van der Auwera and O'Connor 2020). When running on a quartet with 30×–35× coverage paired read data, the workflow takes a little more than 8000 CPU h, for a total cost of ∼$100 (Supplemental Table S30). The VG-Pedigree pipeline makes up the majority of the computation at about 8000 CPU h and costs $92–$95, whereas the candidate analysis workflow runs in about 200 CPU h and costs $3–$5. Costs can vary based on the load of the cloud compute system and the availability of lower-cost preemptable nodes.
Discussion
There is growing evidence that rare variants have the effect sizes, diversity and abundance necessary to explain a substantial portion of human genetic load (Simons et al. 2014; Hernandez et al. 2019; Li et al. 2017). Pedigrees can help resolve harder-to-study regions by giving orthogonal evidence in the form of Mendelian inheritance to enhance the statistical power and phasing accuracy to categorize compound-heterozygote and de novo variation from a list of called variants (Roach et al. 2010; Shugart et al. 2012; Peng et al. 2013; Sul et al. 2016). Graph-based approaches leverage additional variation information during read mapping to mitigate the problems of alignment to complex regions of the genome (Garrison et al. 2018; Sirén et al. 2021). The methods and software developed in this project are designed to maximize the biological information available to detect and interpret individual-level variation. The software developed is scalable so that it can easily run on high-performance compute clusters that support common batch systems like Slurm (Yoo et al. 2003) or Kubernetes (Kane and Matthias 2018). It is publicly accessible in the toil-vg GitHub repository and in WDL format, which is published in the Dockstore repository (O'Connor et al. 2017; Van der Auwera and O'Connor 2020).
Alignment and genotyping performance of short-sequenced reads is improved across all examined confident regions in the GIAB samples. This is due to the parental genotypes contributed to the pangenome reference used in the Giraffe-Parent method that better match the child's reads. The result of these improvements translates to better coverage, mapping quality, and greater variant calling accuracy in both confident and difficult regions of the genome. All examined UDP cases that have a known genetic diagnosis based on the Mendelian models covered by the previously published candidate analysis workflow have their causal variants recapitulated by this workflow (Gu et al. 2019). The candidate analysis evaluation indicates detectable differences in the number of candidate DVs identified between the affected and unaffected offspring populations. This result shows a similar trend to that of the analysis done on exome data sets from a larger sample set, which also showed a statistically significant difference (Gu et al. 2019). The main improvement in this analysis over the previous analysis is that this analysis covers the whole genome including intronic and intergenic regions.
A number of areas can be improved within this workflow. One example is the training model used in DeepTrio. Our training used a very limited number of benchmark samples, which was limited further to leave benchmark data for testing and development. Given these limitations, there is room to improve the DeepTrio model when additional well-sequenced and diverse benchmark samples become available.
Variant calls from graph-based alignments are prone to error due to the conversion of the native graph alignment map (GAM) format output from VG alignments to the linear reference BAM format. Information about the exact path of reads is lost during this projection step which can result in reads appearing different from the linear reference genome when the variant is already present in a path in the graph reference.
Structural variants (SVs) are an important component of the set of rare variants that contribute to disease (Weischenfeldt et al. 2013; Abel et al. 2020). In previous work, there have been efforts to tailor pangenome graphs and variant caller algorithms to improve the accuracy of detecting SVs (Sirén et al. 2021). Another avenue to improve this workflow is to apply pangenome graphs with incorporated SV information as a module that runs concurrently with the VG-Pedigree workflow. One of the samples in the candidate DV analysis was missed by this workflow as it contained a large SV deletion. Incorporating SVs into the VG-Pedigree workflow would aid in the detection of such variants.
Refinements to the CADD scoring metrics can be made to enhance the detection of specific variants. One of the samples in the candidate DV analysis that was missed by this workflow was a male with a de novo variant on the X Chromosome with a low CADD score that did not pass the workflow's default CADD threshold. To remedy this, the CADD threshold for de novo male X-linked variants can either be lowered to enhance sensitivity or the CADD program would need to adjust their scoring metrics to take into account such variants and up-weigh their scores.
Further runtime improvements could also be made. The workflow takes about 1.5 d and approximately 8000 total CPU h at a cost of about $100 to process one family. This is moderately expensive and slow relative to traditional methods, which have well-tuned hardware acceleration solutions and years of work optimizing computation time. GPU acceleration or field-programmable-gate-array (FPGA) implementations of the graph alignment algorithm could substantially accelerate the computation of the graph-based algorithms.
There are a number of refinements that could be made to the most expensive parts of this workflow. Reference construction of the parental graph could be improved by altering and pruning the haplotype index with the haplotypes discovered by the trio-backed phasing stage of the pipeline. The use of graph-based variant callers would remove the need to subject alignments to linear BAM files and therefore maintain potentially more information that could be used to produce more accurate calls.
Additional orthogonal methods can be applied to the workflows presented. The reconstruction of sequences in a sample from sequence data alone, known as de novo genome assembly, can be used to support evidence of the genotypes detected in this workflow. One tool, known as WHdenovo, can apply pedigree information and long-sequence reads to enhance the construction of sample-specific assemblies that can resolve potential genotyping errors in this workflow (Garg et al. 2020; Garg 2021).
New pangenome graphs are continuously being updated and tested as more population variation is characterized. The Telomere-to-Telomere genome project (T2T) has recently released a genome reference which exhaustively captures the centromeric and telomeric sequence better than the previous GRCh38 version of the human genome (Nurk et al. 2022). The Human Pangenome Reference Consortium (HPRC) is a group of research institutions that are tasked with the development of a pangenome reference using the latest methods and data. By characterizing regions of the genome not well-represented by existing variant data sets, the pangenome references developed by the HPRC that incorporate new T2T sequences should further improve the performance and accuracy of the workflows presented in this paper.
Methods
VG-Pedigree workflow
Pangenome graphs provide a framework for leveraging genomic variation information to create a better-informed mapping procedure than that provided by a linear genomic reference. The workflow presented here goes through a number of stages (Fig. 1A). The first stage establishes parental haplotypes to construct a parental-backed graph reference. It takes short reads from a trio and aligns each to a population-informed graph reference. We use a graph based on the 1000 Genomes data set (The 1000 Genomes Project Consortium 2015; Sirén et al. 2021). It is still the largest and most diverse set of phased genotypes available to the public with broad consent. The 1000GP graph is based on the hs38d1 human reference genome and the 1000 Genomes Project phase 3 variant set that has been lifted over from GRCh37 to GRCh38 genome coordinate space and is available in a publicly accessible Google Cloud bucket.
Alignment of the parent-child trio to the 1000GP graph goes through a number of steps that split and merge read alignments to enable distributed computation (Fig. 1B; Supplemental Fig. S5). This greatly reduces time spent aligning reads, which is a major bottleneck for the workflow. Afterwards, each chunked alignment is projected back to the linear genome reference coordinate space and corrected for duplicates and missing mate information, and indels are realigned using ABRA2 (Mose et al. 2019). Following alignment, samples in the trio are variant-called, producing a per-sample gVCF genotype called file. A trio-based DeepVariant extension (Poplin et al. 2018a), Google's DeepTrio (Kolesnikov et al. 2021), is used to call variants in this workflow. DeepTrio first generates images based on the alignments between the parent and child reads. Then, the DeepTrio variant caller is run concurrently to call gVCFs for each contig for each sample in the trio. The gVCFs are next joint-called with the Glnexus package (Yun et al. 2021) in order to merge and recall potentially uncalled variants in the trio. Joint-calling gVCFs enhances DeepVariant-based calls by reexamining trio variant sites that were confidently called in one sample but not another. The joint-called trio VCF is then divided by autosomal and sex-chromosomal contigs, with the mitochondrial contig only preserving the maternal set of called genotypes and the Y chromosomal contig preserving the paternal set of called genotypes.
A number of different schemes for phasing these variants were explored using combinations of Eagle (Loh et al. 2016), WhatsHap (Martin et al. 2016), and SHAPEIT4 (Delaneau et al. 2019). Supplemental Table S31 illustrates the performance of combinations of these programs when phasing the GIAB HG002 sample. Supplemental Table S32 shows phasing performance for the GIAB Ashkenazi trio with respect to GRCh38- or GRCh37-based graph alignments. Using Eagle followed by WhatsHap produced the largest blocks of phased variants while maintaining a switch error rate close to, or better than, the method with the largest median haplotype block size from this list: WhatsHap in combination with SHAPEIT4. Following the alignment and variant calling step, a phasing subpipeline is run on these contig VCFs using the Eagle-WhatsHap phasing method (Fig. 1C; Supplemental Fig. S6). Missing genotypes are imputed using Eagle version 2.4.1 (Loh et al. 2016). Finally, the contig VCFs are phased with trio- and read-backed methods using WhatsHap (Martin et al. 2016). That final set of contig VCFs is then filtered down to just the parental genotype sets and passed into the graph construction workflow.
Following the phasing stage of the workflow, the phased variants from that step and a linear reference in FASTA are passed as input into the graph construction step (Fig. 1D; Supplemental Fig. S7). VG mappers use a variety of indexes (Sirén et al. 2021). To facilitate this need, the construction workflow generates a combination of indexes based on the requirements of the VG Giraffe mapper.
After constructing the parental graph, the offspring reads can be realigned to it. GVCFs are called from offspring alignments to the parental graph reference (Fig. 1B; Supplemental Fig. S5). Finally, variants are jointly called, once again with the Glnexus package (Yun et al. 2021), by combining previously computed gVCFs of the 1000GP-aligned parents with gVCFs derived from the parental graph-aligned offspring.
The methods developed here for the VG-Pedigree workflow are implemented in the software framework toil-vg under the “toil-vg pedigree” subcommand which makes use of the TOIL workflow engine (Vivian et al. 2017) for cloud-based and cluster-compute systems and is available at GitHub (https://github.com/vgteam/toil-vg).
The workflow is also made available in WDL format in the Dockstore (O'Connor et al. 2017; Van der Auwera and O'Connor 2020) repository at https://dockstore.org/workflows/github.com/vgteam/vg_wdl/vg-pedigree-giraffe-deeptrio:master.
Candidate analysis workflow
A primary endpoint goal for this workflow is variant detection to identify likely causes of the genetic disorders in the UDP cases. Traditional variant filtration techniques narrow down a set of variants, but they are usually not exhaustive enough to narrow the list down to an actionable number of variants without truncation (Kobren et al. 2021; Pedersen et al. 2021). Further, they often do not specialize in the detection of compound-heterozygous candidates in noncoding regions. Traditionally, a large proportion of work is needed to validate the clinical functionality for each variant (Baldridge et al. 2017). Given this downstream cost, this workflow focuses on reducing that cost by minimizing the number of variants that need to be examined in the final list. The analysis workflow takes in a very large set of variants and filters them by examining a series of variant attributes, each of which follows an order of most-certain to least-certain true-positive data types (Fig. 1F).
Additional improvements and features were added to this implementation of the methods developed in the Gu et al. (2019) study. In this paper, we have adapted all components and annotations used by the workflow to be compatible with the GRCh38 reference genome coordinate system. The CADD engine software suite has been updated to version 1.6 which incorporates greater accuracy in determining deleterious variants located in splice sites and introns (Rentzsch et al. 2021). We have also updated the population annotation data set to use gnomAD v3.1, which has incorporated a larger proportion of samples producing more accurate and exhaustive population allele frequencies (Karczewski et al. 2020). The maximum minor allele frequency (MAXMAF) calculation implemented in the population/deleterious-backed variant filtration module was altered to use a binomial instead of a Poisson distribution (Supplemental Fig. S8D). A critical bug was patched that was found to erroneously output X-linked candidate variants for females. We implemented a new module that automatically detects the presence, location, and type of copy number variant (CNV) mosaicism in the proband.
The alignment and variant calling workflow output is processed with various annotation programs before they are able to be passed as input into the candidate analysis workflow. Post-processing the final data sets comprises SnpEff annotation, indel-realignment, and converting to a one-variant-per-row format that has pedigree-consistent indels, for each of the samples in the pedigree (Fig. 1E; Supplemental Fig. S9). The CADD (Rentzsch et al. 2021) software suite is used in this analysis workflow to predict the deleteriousness of a given variant. Any variants that are unique to the CADD database in the joint VCF have a deleterious score calculated by the software.
The analysis portion of the workflow examines and filters the pedigree variant file in the context of Mendelian inheritance, alignments against the parental-based graph reference, population variant frequency, and predictions of variant effects on gene function and expression (see Supplemental Methods S5; Gu et al. 2019). Using these filters generates a set of variants that are further filtered by examining the BAM files for sequence and alignment noise surrounding each variant (Gu et al. 2019). This produced a final short list for clinical examination. The workflow then cleans up the resulting candidate list of identifiable errors and artifacts. Typical candidate lists produced by this pipeline consist of 10–50 variants (Supplemental Tables S27, S28). These lists include compound-heterozygous variants located in noncoding regions of the genome.
One new implementation of the workflow is the detection of CNV mosaicism. Mosaicism is a genetic event where a single sample possesses multiple populations of cells that possess different proportions of variants. The goal of the program is to detect stretches of phased variants that show consistent and significant evidence for deviation in allele depth (AD) contributed by the mother and father. The first step is to phase a set of heterozygous genotypes in the proband by examining the parental genotypes. The phasing done here is more stringent than in the previous method described in the VG-Pedigree workflow because we are looking for a sequence of easily phasable SNPs and so the procedure is rule-based, instead of WhatsHap which is based on statistical models. A given genotype in the proband is phasable if two conditions are met: at least one parent has a homozygous genotype, and the other parent is heterozygous. If a large enough proportion of genotypes are phased in this way, the program examines regions of sufficient length for consecutive stretches of allele balance deviation. A sliding window of 10,000 phased genotypes is used to scan each chromosome and find the boundaries of the mosaic region. For each SNP within this window, the AD of one parent is subtracted from the AD of the other parent. A t-test is applied to the list of AD differences within the window to test if the distribution is significantly different from the null model of no difference. If the t-test statistic is greater than the input threshold, then a region of possible mosaicism is detected and subsequently logged in a separate file for further examination. This threshold was determined empirically against mosaic-positive samples obtained by the UDP. This differs from traditional CNV callers in that this program incorporates trio information to look for partial deletion or duplication events at megabase scales at a continuous level of granularity.
This program can also determine three types of mosaicism: uniparental isodisomy-disomy, trisomy-disomy, and monosomy-disomy. In uniparental isodisomy-disomy mosaicism, the individual has populations of cells where a proportion of their genome shares both copies from only one of their parents, and the rest of their cells have inherited a copy from both parents. These types of mosaics are detected by examining the total read depth of the child and parents within the candidate mosaic region. If the proportion of total read depth between the child and parents is the same, and the proportion of ADs of the phasable SNPs between the child and parents is not the same, then the program will classify the mosaic region as uniparental isodisomy-disomy.
In trisomy-disomy mosaicism, the individual has populations of cells where a proportion of their genome has inherited two copies of the same chromosome from one of their parents and one copy from the other parent, and the rest of their cells have inherited a copy from both parents. If the proportion of total read depth in the child is greater than their parents, then the region is classified as trisomy-disomy mosaicism. Alternatively, in monosomy-disomy mosaicism, the individual inherits only one copy from only one parent in some of their cells, and the rest of their cells inherit one copy from each parent. In this case, if the total read depth in the child is less than that of their parents, then the region is classified as monosomy-disomy mosaicism.
All modules have been implemented in software containers to improve portability and interoperability with other workflow engines (Schulz et al. 2016; Kane and Matthias 2018). The candidate analysis workflow is implemented within the toil-vg software package under the toil-vg analysis subcommand. The candidate analysis workflow is also available in WDL format in the Dockstore repository (https://dockstore.org/workflows/github.com/cmarkello/bmtb_wdl/bmtb:main).
Candidate deleterious variants for the proband and sibling populations of the 15 cohort proband-sibling pairwise analysis can be found as Supplemental Data. The deidentified sequencing and phenotype data for all Undiagnosed Diseases Network (UDN) and UDP samples used in the candidate analysis evaluation are available in the National Center for Biotechnology (NCBI) database of Genotypes and Phenotypes (dbGaP; https://www.ncbi.nlm.nih.gov/gap/) under the accession number phs001232.v4.p2.
Software availability
Both the VG-Pedigree workflow and the candidate analysis workflow are implemented in the software workflow engine TOIL (Vivian et al. 2017) for cloud-based and cluster-compute systems under the software framework toil-vg. They are callable using the “toil-vg pedigree” and “toil-vg analysis” subcommands, respectively. “toil-vg” is available at GitHub (https://github.com/vgteam/toil-vg). The workflows are also made available in WDL format in the Dockstore (O'Connor et al. 2017) repository at https://dockstore.org/workflows/github.com/vgteam/vg_wdl/vg-pedigree-giraffe-deeptrio:master and https://dockstore.org/workflows/github.com/cmarkello/bmtb_wdl/bmtb:main.
Input data and scripts used in the mapping evaluation, variant calling evaluation, and runtime evaluation are all publicly available and listed in the open source code (MIT license) as provided in Supplemental Code and are also available from GitHub (https://github.com/cmarkello/vg-pedigree-paper).
Low-complexity, low-mappability, and MHC regions were defined by the following BED files, respectively, and intersected using BEDTools against the GIAB sample-specific all confident region benchmark BED files: https://ftp-trace.ncbi.nlm.nih.gov/ReferenceSamples/giab/release/genome-stratifications/v2.0/GRCh38/LowComplexity/GRCh38_AllTandemRepeatsandHomopolymers_slop5.bed.gz, https://ftp-trace.ncbi.nlm.nih.gov/giab/ftp/release/genome-stratifications/v2.0/GRCh38/union/GRCh38_alllowmapandsegdupregions.bed.gz, https://ftp-trace.ncbi.nlm.nih.gov/giab/ftp/release/genome-stratifications/v2.0/GRCh38/OtherDifficult/GRCh38_MHC.bed.gz (Quinlan and Hall 2010; Wagner et al. 2021b). The analysis of called variants in the HG002 complex medically relevant genes used the HG002 CMRG v1.00 VCF https://ftp-trace.ncbi.nlm.nih.gov/giab/ftp/release/AshkenazimTrio/HG002_NA24385_son/CMRG_v1.00/GRCh38/SmallVariant/HG002_GRCh38_CMRG_smallvar_v1.00.vcf.gz and BED file https://ftp-trace.ncbi.nlm.nih.gov/giab/ftp/release/AshkenazimTrio/HG002_NA24385_son/CMRG_v1.00/GRCh38/SmallVariant/HG002_GRCh38_CMRG_smallvar_v1.00.bed (Wagner et al. 2021a). Sample-specific difficult region BED files were extracted from https://ftp-trace.ncbi.nlm.nih.gov/ReferenceSamples/giab/release/genome-stratifications/v3.0/GRCh 38/GenomeSpecific/.
Competing interest statement
P.C. and A.C. are employees of Google and own Alphabet stock as part of the standard compensation package. The remaining authors declare no competing interests.
Acknowledgments
We thank Dr. William Gahl, Dr. David Adams, and the members of the NHGRI Undiagnosed Diseases Program for providing the resources, experiment execution assistance, and data access that has made this project possible. We also thank Jouni Sirén, Erik Garrison, Xian Chang, Jean Monlong, Adam Novak, and the rest of the Variation Graph team at the UCSC Genomics Institute for providing the tools and methods developed from which much of this work is built upon. All pipelines and evaluations used the computational resources of the NIH HPC Biowulf cluster at the National Institutes of Health, Bethesda, MD (https://hpc.nih.gov). C.H., A.R., and T.M. are supported in part by the Intramural Research Program of the National Human Genome Research Institute and the Common Fund, Office of the Director, National Institutes of Health. Research reported in this publication was supported by the National Institutes of Health under Award Numbers U41HG010972, R01HG010485, U01HG010961, OT3HL142481, OT2OD026682, U01HL137183, and 2U41HG007234. The views expressed in this manuscript are those of the authors and do not necessarily represent the views of the National Institutes of Health.
Author contributions: C.M., C.H., A.R., T.M., and B.P. planned the analysis. Software and containers were developed by C.M., C.H., A.R., and T.M. DeepVariant and DeepTrio training was planned and executed by A.C. and P.C. C.M. and T.M. analyzed the results. C.M. prepared the manuscript with editing assistance and advice from J.E., D.H., and B.P.
Footnotes
-
[Supplemental material is available for this article.]
-
Article published online before print. Article, supplemental material, and publication date are at https://www.genome.org/cgi/doi/10.1101/gr.276387.121.
- Received November 24, 2021.
- Accepted March 24, 2022.
This article is distributed exclusively by Cold Spring Harbor Laboratory Press for the first six months after the full-issue publication date (see https://genome.cshlp.org/site/misc/terms.xhtml). After six months, it is available under a Creative Commons License (Attribution-NonCommercial 4.0 International), as described at http://creativecommons.org/licenses/by-nc/4.0/.