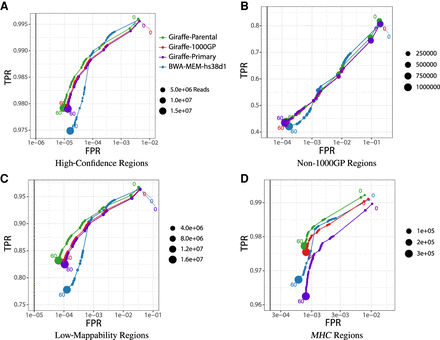
Mapping performance of 100 million read pairs simulated from HG002 high-confidence data sets. Four different alignments are compared across four different regions and ROC curves are plotted with a log-scaled false positive rate on the x-axis and a linear-scaled true positive rate on the y-axis with the mapping quality as the discriminating factor. Green curves represent graph alignments against the parental graph reference constructed from HG003 and HG004 Illumina read graph alignments. Red curves represent alignments against the 1000GP graph reference. Purple curves represent alignments to the primary GRCh38 linear graph reference. Blue curves represent linear alignments against the hs38d1 reference using BWA-MEM. (A) Alignments in GIAB v4.2.1 confident regions (from 10 million simulated read set). (B) Alignments in non-1000GP confident regions (from 10 million simulated Illumina read set). (C) Alignments in GIAB v4.2.1 low-mappability regions (from 100 million simulated Illumina read set). (D) Alignments in GIAB v4.2.1 MHC regions (from 100 million simulated Illumina read set).


