
Model Explorer: Graph visualization for large model development
May 14, 2024
Na Li, Tech Lead Manager, and Jing Jin, Software Engineer, Google CoreML
Model Explorer is a powerful graph visualization tool that helps one understand, debug, and optimize ML models. It specializes in visualizing large graphs in an intuitive, hierarchical format, but works well for smaller models as well.
Quick links
Graph visualization plays a pivotal role in the machine learning (ML) development process. Visual representations of models help researchers and engineers debug conversion and quantization issues, identify performance bottlenecks, find patterns for optimization (e.g., operation fusion), and gain insights into model architecture. These practices are useful for many types of models, in particular when deploying models to devices with limited resources, such as mobile phones and browsers. However, the increasing scale and complexity of modern ML and AI models (e.g., Transformers and diffusers) pose significant challenges to existing visualization tools. Large-scale Transformer-based models often overwhelm conventional graph visualizers, resulting in rendering failures or unmanageable visual complexity. In addition, the lack of a clear visual hierarchy complicates one’s understanding of node relationships.
To address these limitations, we introduce Model Explorer, a novel graph visualization solution that can handle large models smoothly and visualize hierarchical information, like function names and scopes. Model Explorer supports multiple graph formats, including those used by JAX, PyTorch, TensorFlow and TensorFlow Lite. Developed originally as a utility for Google researchers and engineers, Model Explorer is now publicly available as part of our Google AI Edge family of products.
Model Explorer proves itself particularly effective in streamlining the deployment of large models to on-device platforms, where visualizing conversion, quantization, and optimization data is especially useful. We describe how Model Explorer combines graphics techniques used in 3D game and animation production, such as instanced rendering and multi-channel signed distance fields (MSDF), and adapts them for ML graph rendering. We show that Model Explorer enables three types of use cases for developing large models: understanding the model architecture, debugging conversion errors, and debugging performance and numeric issues.
Model Explorer visualizes large models smoothly and with hierarchical information.
Challenges in large graph visualization
There are two major technical challenges to visualizing large model graphs. First, layout algorithms struggle to scale with larger graphs: as the number of nodes grows, their computational complexity rises dramatically, leading to significant slowdowns at the layout phase and occasional complete failures. Even successful layouts tend to be overly dense and complex, detracting from their interpretability. Second, most existing model visualization tools use Scalable Vector Graphics-based rendering, which is not designed for rendering a large number of objects. Zooming and scrolling operations become sluggish and unresponsive, leaving the visualizers unusable.
Inspired by the hierarchical layout concept in the Tensorboard graph visualizer, we developed a library that extracts hierarchical information from mainstream authoring frameworks like TensorFlow, PyTorch, and JAX. We then built an interactive system that visualizes nodes starting from the topmost layers, allowing users to progressively navigate the graph by expanding layers one by one, or revert to higher-level layers by collapsing layers. This allows users to inspect the internal structure and connections within a graph at the granularity they need. Since the layout algorithm operates on a per-layer basis, Model Explorer calculates the layout computation when the user chooses to open a layer. This method avoids unnecessary computation for all the nodes during the initial graph loading, and significantly improves performance for large models.
We address the second challenge by implementing GPU-accelerated graph rendering with WebGL and three.js. As a result, we achieve a smooth 60 frames-per-second (FPS) user experience, i.e., 60 individual images are displayed every second on the screen, creating smooth and life-like motion in interactions and animations, even with graphs containing tens of thousands of nodes. In addition, we leverage instanced rendering techniques to simultaneously render multiple copies of an object at different locations in a scene. The example below shows how a graph with 50,000 nodes and 5,000 edges (randomly generated for demonstration purposes) is rendered smoothly at 60 FPS on a 2019 Macbook Pro with an integrated GPU. To improve visual continuity, we added smooth animations for layer navigation, helping users maintain their understanding of where they are within the model's structure.
Model Explorer renders a graph with 50,000 nodes and 5,000 edges (randomly generated for demonstration purposes) at 60 FPS smoothly.
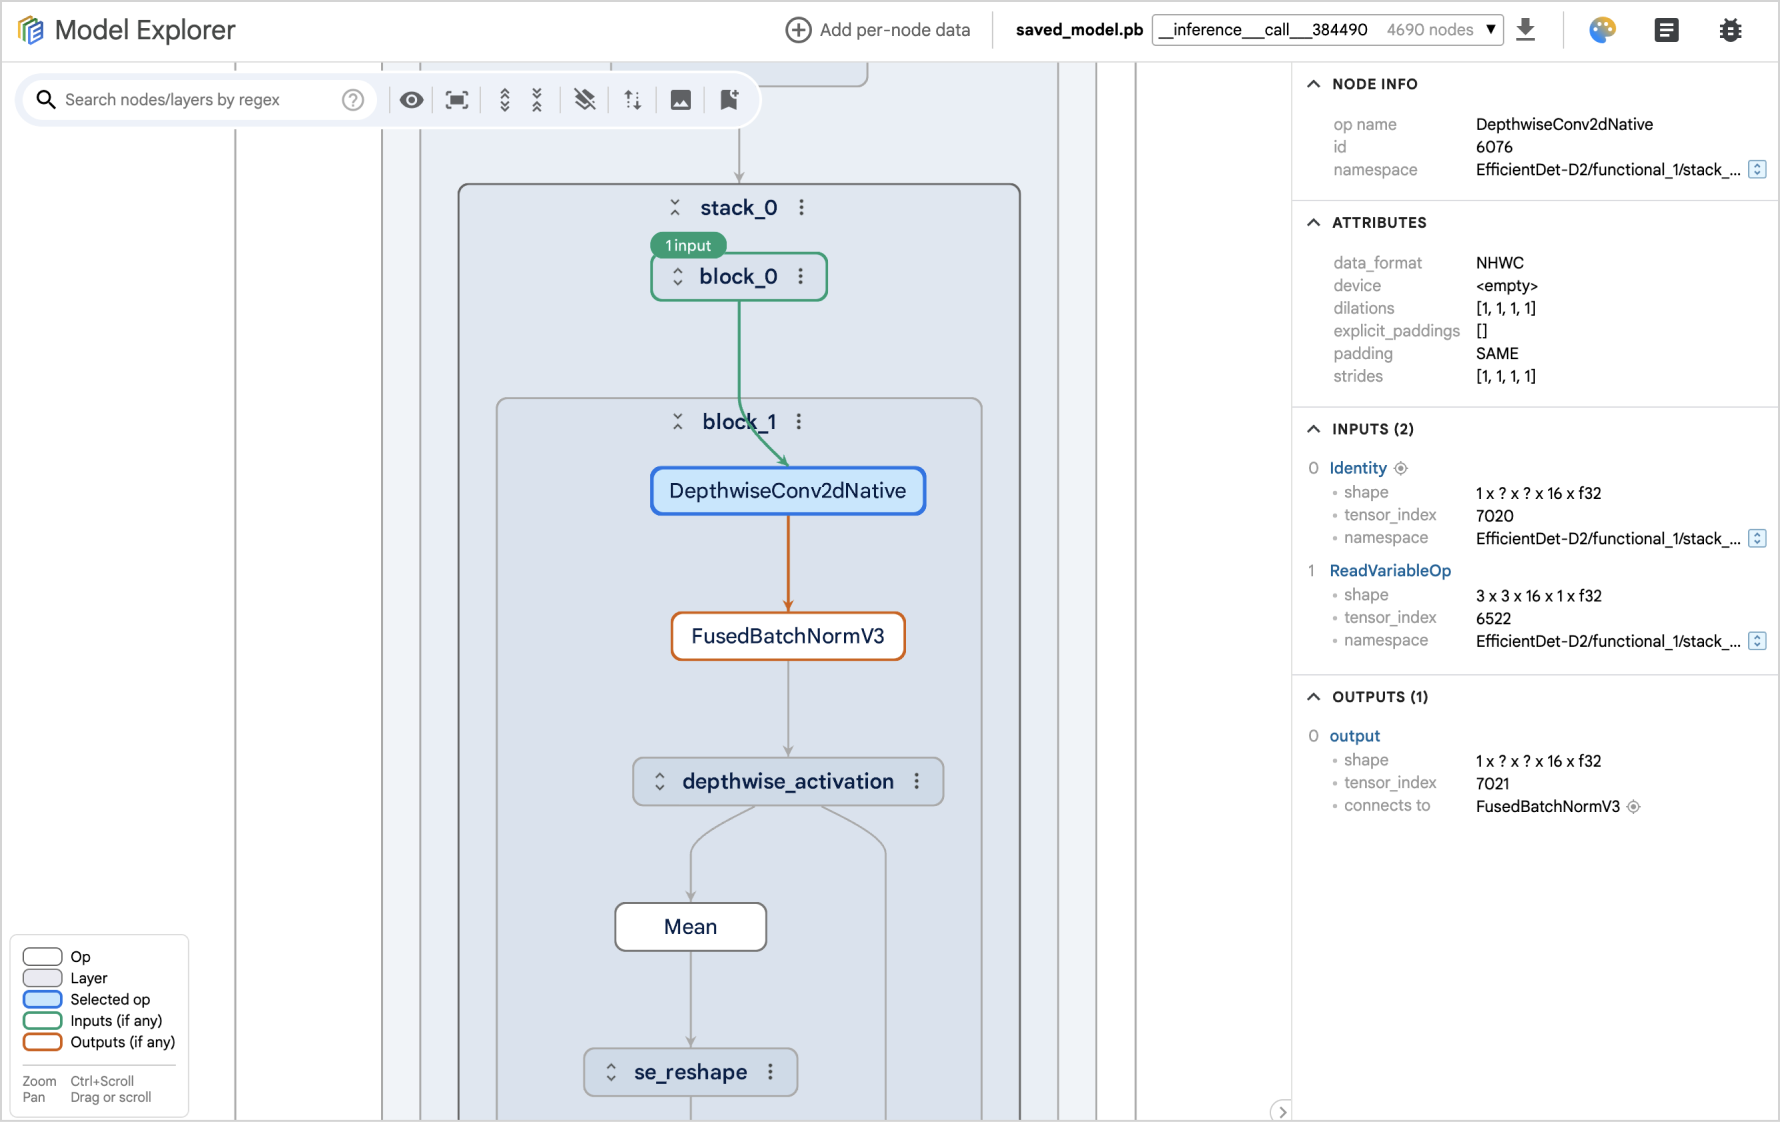
Understanding model architecture
Large models become easier to understand with layer-based views and the ability to navigate complex structures. For example, in this MobileBert model below, it’s evident that the self-attention mask and the embedding are fed into a transformer layer. The expanded view of the embedding layer shows the relationship between different types of the embeddings. With almost 2,000 nodes in total, this model would be almost impossible to understand without this hierarchical information.
 |
With layer information, such as self_attention_mask, embedding and transformer_layer, it’s easy to understand model architecture. |
Debugging conversion errors
Before deployment onto specific hardware, such as phones or laptops, ML models must go through a conversion process: for example converting a PyTorch model to a Tensorflow Lite model. However, information about the transformation is often lost during conversion. To help compare multiple graphs, Model Explorer offers a side-by-side comparison mode. The example below highlights how a subgraph within one layer (i.e., torch.nn.modules.linear.Linear_attn) has changed during the conversion from PyTorch to TensorFlow Lite. Comparing the shape and data type information of the input and output of the layer can help highlight conversion errors.
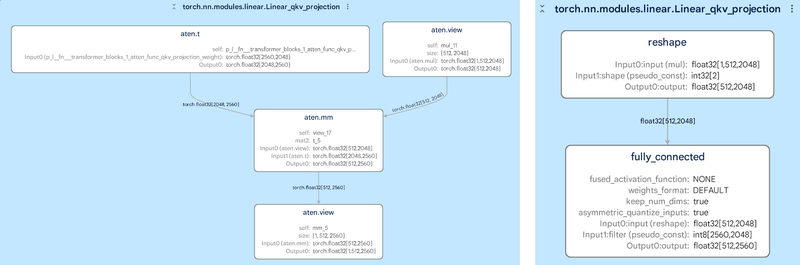
A side-by-side comparison of the original PyTorch model (left) and the optimized TensorFlow Lite model (right) – useful when debugging model graph conversion.
Debugging performance and numeric accuracy
Another Model Explorer feature is its ability to overlay per-node data on a graph, allowing users to sort, search, and stylize nodes using the values in that data. Combined with the hierarchical view, participants in our user studies shared that it helps them quickly narrow down performance or numeric issues to a certain area in the graph, and that without this visualization, these insights would have been much more elusive. The example below shows the mean squared error of a quantized TFLite model versus its floating point counterpart. Using Model Explorer, users were able to quickly identify that the quality drop is near the bottom of the graph, and adjust their quantization method.
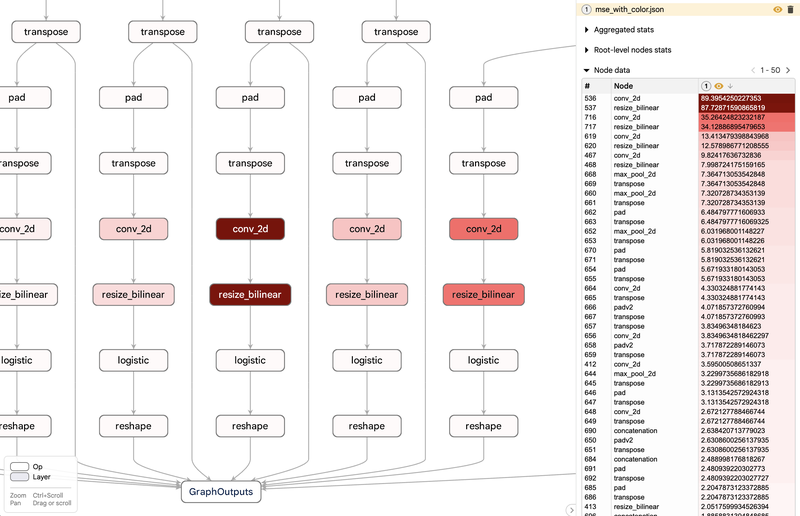
This per-node data overlay allows users to quickly identify performance or numeric issues within a model.
Conclusion
Model Explorer introduces a powerful new way to examine architecture and debug issues in models of almost any size, without compromising user experience or rendering performance. It presents model structures with clarity, using layers and grouping to improve understanding, and incorporates debugging features and layer-level insights to support model analysis.
Model Explorer is now publicly available. Visit the Model Explorer site for installation instructions, and to provide feedback.
Acknowledgements
This work is a collaboration across multiple functional teams at Google. We would like to extend our thanks to engineers Eric (Yijie) Yang, Akshat Sharma, Chi Zeng, Jacques Pienaar, Chun-nien Chan, Jun Jiang, Matthew Soulanille, Arian Arfaian, Majid Dadashi, Renjie Wu, Zichuan Wei, Advait Jain, Ram Iyengar, Matthias Grundmann, Cormac Brick, Ruofei Du, our Technical Program Manager, Kristen Wright, and our Product Manager, Aaron Karp. We would also like to thank the UX team including Zi Yuan, Anila Alexander, Elaine Thai, Joe Moran and Amber Heinbockel.
Quick links
Other posts of interest
-

May 30, 2024
Few-shot tool-use doesn’t really work (yet)- Generative AI ·
- Natural Language Processing
-

May 29, 2024
ChatDirector: Enhancing video conferencing with space-aware scene rendering and speech-driven layout transition- Human-Computer Interaction and Visualization ·
- Machine Intelligence
-

May 28, 2024
USER-LLM: Efficient LLM contextualization with user embeddings- Human-Computer Interaction and Visualization ·
- Machine Intelligence