Skip to content
New issue

Have a question about this project? Sign up for a free GitHub account to open an issue and contact its maintainers and the community.

By clicking “Sign up for GitHub”, you agree to our terms of service and privacy statement. We’ll occasionally send you account related emails.

Already on GitHub? Sign in to your account

aggregated preview shows the wrong duration #396

Open
mfbarad opened this issue Dec 1, 2022 · 9 comments
Open

aggregated preview shows the wrong duration #396

mfbarad opened this issue Dec 1, 2022 · 9 comments

Comments

@mfbarad
Copy link

mfbarad commented Dec 1, 2022

See #394

{ "traceEvents": [
{ "pid": 1,"tid": 0,"ts": 0,"dur":100,"ph": "X","name": "foo"},
{ "pid": 2,"tid": 0,"ts": 0,"dur":100,"ph": "X","name": "bar"},
] }

The aggregated preview, which is important for my usage case, shows the Process 1 and 2 durations as 50 instead of 100. Thanks

Screen Shot 2022-12-01 at 10 47 04 AM

@TaoK
Copy link

TaoK commented Jan 5, 2023

I also see this - it took me a long time to understand that the strange markings in the aggregated view are actually supposed to be the overview of the expanded details, because they are typically (much) shorter.

@nikhilkalige
Copy link

I spent some time debugging this problem. I changed the line below to select ts, dur, and that does fix the problem for me.

`select ts, dur/${utids.length} as dur ` +

@mfbarad
Copy link
Author

mfbarad commented Mar 12, 2023

@nikhilkalige are you going to make a merge request? @chromy and @primiano might be able to assist. They commented on a previous version of this issue: #394 Thanks all!

@nikhilkalige
Copy link

nikhilkalige commented Mar 12, 2023

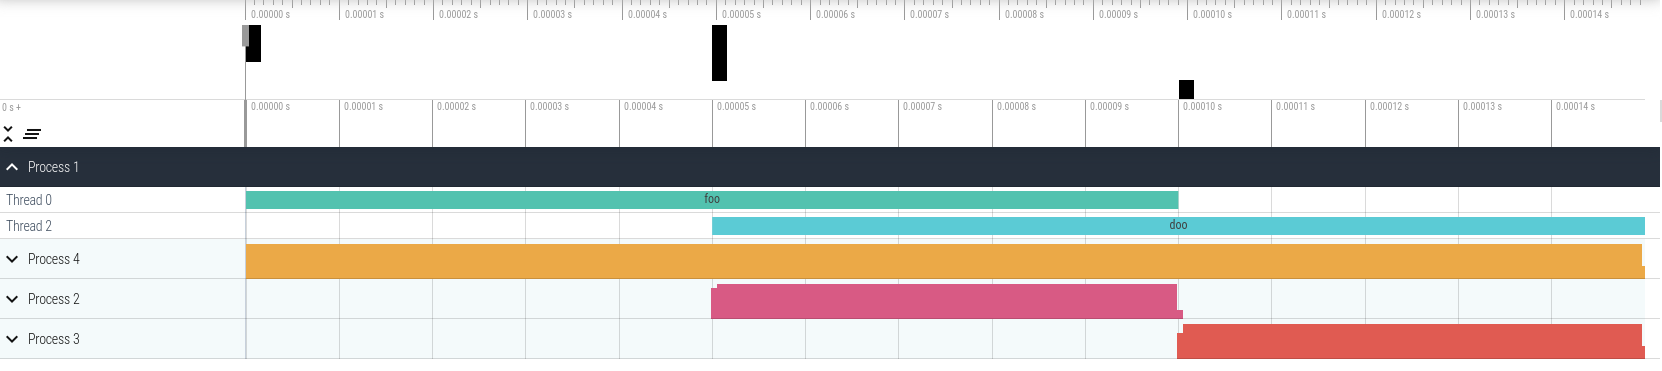
@mfbarad I sure can.. But I wasn't sure if that is the expected behaviour. I also don't understand how utilization is supposed to impact the height of the summary bar. For example with the data, you see the width is correct with the change above, but the height stays the same for PID 1 & 4, even though from 50 to 100, there are two threads doing some work.

{ "traceEvents": [
  { "pid": 1,"tid": 0,"ts": 0,"dur":100,"ph": "X","name": "foo"},
  { "pid": 1,"tid": 2,"ts": 50,"dur":100,"ph": "X","name": "doo"},
  
  { "pid": 4,"tid": 0,"ts": 0,"dur":100,"ph": "X","name": "foo1"},
  { "pid": 4,"tid": 2,"ts": 50,"dur":100,"ph": "X","name": "doo1"},

  { "pid": 2,"tid": 0,"ts": 50,"dur":50,"ph": "X","name": "bar"},
  { "pid": 3,"tid": 0,"ts": 100,"dur":50,"ph": "X","name": "car"},
]}

Screenshot from 2023-03-11 23-52-43

@nikhilkalige
Copy link

I am unsure about the span_join used to compute the utilization. In the case above,

select * from process_slice_view_542258dc_c3fc_4592_8af4_3bef476632a1
ts	dur
0	100000
50000	100000
select * from window_55e09221_7058_4685_8c7f_c94def855b75
this is just bunch of 640.. 

The span_join is supposed to add something up when there are overlaps right, but what does it add? In the test case written in C++, I see that it adds up fvalue, but I don't know what it does here. select * from span_542258dc_c3fc_4592_8af4_3bef476632a1, shows ts, dur, quantum_ts. I was expecting that there would be duplicate quantum_ts values for the overlaps, but I don't. Only overlapping value is below,

98560  640  389
99200  640  390
99840  160  391
99840  640  391
100480 640  392

@nikhilkalige
Copy link

I think we need to update the process_slice_view table to generate the following output

Ts Dur
100 10
105 15

this instead of above
ts  dur num_active_threads
100 5  1
105 5  2
110 10 1

@chromy
Copy link
Contributor

chromy commented Mar 13, 2023

@nikhilkalige: Thanks for looking into this!

Yes the line you linked above does seem pretty suspect 😦.
I need to re-familiarise myself with that file though which I will try to get to this week.

@nikhilkalige
Copy link

@chromy I have a bit better idea of what span join does now. I think the problem in using spanjoin could be that it does take into account overlapping spans from the same table ( I hope that I understood that correct). I tried a bit, but could not come up with a query that generates output like I showed above.

@mfbarad
Copy link
Author

mfbarad commented Apr 4, 2023

@chromy @nikhilkalige Is there any progress on this? Thanks so much.

Sign up for free to join this conversation on GitHub. Already have an account? Sign in to comment
Labels
None yet
Projects
None yet
Development

No branches or pull requests

4 participants