The number of transactions done through the Bharat Interface for Money (BHIM) app amounted to over 22 million as of June 2023. Since August 2020, the transaction volume had been fluctuating on a comparatively high level above 20 million transactions.
Number of transactions done through BHIM in India from January 2017 to June 2023 (in millions)
Basic Account
Get to know the platform
You only have access to basic statistics.
This statistic is not included in your account.
Starter Account
The ideal entry-level account for individual users
- Instant access to 1m statistics
- Download in XLS, PDF & PNG format
- Detailed references
$199 USD / Month *
Professional Account
Full access
Business Solutions including all features.
* Prices do not include sales tax.
Other statistics that may interest you Digital payments in India
Market overview
7
- Premium Statistic Top 10 countries worldwide with highest number of contactless card transactions 2022
- Premium Statistic RBI's digital payment index India 2018-2023
- Premium Statistic Digital payments transaction value in the APAC region 2022, by country and segment
- Premium Statistic Volume of digital payments India FY 2018-2023
- Premium Statistic Value of digital transactions in India FY 2020-2027
- Premium Statistic Volume of digital payments in India FY 2024, by mode
- Premium Statistic Share of payment systems India FY 2024
Infrastructure
7
- Premium Statistic Leading UPI beneficiary banks in India 2023, by volume
- Premium Statistic BHIM UPI QR code in India 2020-2022
- Premium Statistic Number of member banks affiliated to NFS India 2018-2023
- Premium Statistic Number of NETC partner banks India 2016-2022
- Premium Statistic Partner banks for IMPS India 2013-2023
- Premium Statistic Partner banks for *99# payments India 2023
- Premium Statistic Number of ATMs under the NFS network India 2018-2023
Key payment methods
8
- Premium Statistic Value of credit transfers India FY 2018-2023, by mode
- Premium Statistic Value of debit transfers India FY 2018-2023, by mode
- Premium Statistic UPI usage in India in Q4 2023, by platform
- Premium Statistic Value of UPI digital payments across India FY 2017-2023
- Premium Statistic Volume of card payments India FY 2014-2022, by type
- Premium Statistic Number of RuPay debit cards issued under PMJDY in India 2023, by sector
- Premium Statistic 
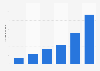
Number of transactions through BHIM India 2016-2023
- Premium Statistic Number of AePs transactions in India 2016-2023
Fintech players
5
- Premium Statistic Leading fintech unicorn startups India H1 FY 2022, by value
- Premium Statistic Revenue from operations of Paytm FY 2017-2023
- Premium Statistic Revenue of MobiKwik FY 2017-2023
- Premium Statistic BillDesk's operating revenue FY 2019-2022
- Premium Statistic Value of PE/VC deals in digital payments and wallets space India 2022, by company
Consumer opinion
5
- Premium Statistic Biggest e-commerce payment brands in India 2024
- Premium Statistic Mobile payments usage by situation in India 2024
- Premium Statistic Reasons for not using e-payment services India 2022, by gender
- Basic Statistic COVID-19 impact on digital payments in India 2020 by type of purchase
- Premium Statistic Preferred mode of payment since COVID-19 India 2020, by age
Further related statistics
14
- Number of IMPS transactions India 2013-2020
- Colombia: financial transactions 2020, by channel
- Transaction value of payments through *99# India 2018-2023
- Transaction value of IMPS India 2018-2021
- Number of transactions made through *99# India 2018-2023
- Share of consumers using computers for banking activities in India 2018 by age group
- Share of consumers using tablets for banking activities India 2018 by age group
- Share of consumers using wearable tech for banking activities India 2018 by age group
- Customer satisfaction with banks in India 2018
- Customer satisfaction with private sector banks in India 2018
- Customer satisfaction with public sector banks in India 2018
- Customer satisfaction with digital payment services offered by banks in India 2018
- Customer satisfaction with digital banking self-service systems in India 2018
- U.S. affluent mobile wallet preference 2017
Further Content: You might find this interesting as well
Statistics
- Number of IMPS transactions India 2013-2020
- Colombia: financial transactions 2020, by channel
- Transaction value of payments through *99# India 2018-2023
- Transaction value of IMPS India 2018-2021
- Number of transactions made through *99# India 2018-2023
- Share of consumers using computers for banking activities in India 2018 by age group
- Share of consumers using tablets for banking activities India 2018 by age group
- Share of consumers using wearable tech for banking activities India 2018 by age group
- Customer satisfaction with banks in India 2018
- Customer satisfaction with private sector banks in India 2018
- Customer satisfaction with public sector banks in India 2018
- Customer satisfaction with digital payment services offered by banks in India 2018
- Customer satisfaction with digital banking self-service systems in India 2018
- U.S. affluent mobile wallet preference 2017
NPCI. (August 3, 2023). Number of transactions done through BHIM in India from January 2017 to June 2023 (in millions) [Graph]. In Statista. Retrieved June 08, 2024, from https://www.statista.com/statistics/1055414/india-number-of-transactions-through-bhim/
NPCI. "Number of transactions done through BHIM in India from January 2017 to June 2023 (in millions)." Chart. August 3, 2023. Statista. Accessed June 08, 2024. https://www.statista.com/statistics/1055414/india-number-of-transactions-through-bhim/
NPCI. (2023). Number of transactions done through BHIM in India from January 2017 to June 2023 (in millions). Statista. Statista Inc.. Accessed: June 08, 2024. https://www.statista.com/statistics/1055414/india-number-of-transactions-through-bhim/
NPCI. "Number of Transactions Done through Bhim in India from January 2017 to June 2023 (in Millions)." Statista, Statista Inc., 3 Aug 2023, https://www.statista.com/statistics/1055414/india-number-of-transactions-through-bhim/
NPCI, Number of transactions done through BHIM in India from January 2017 to June 2023 (in millions) Statista, https://www.statista.com/statistics/1055414/india-number-of-transactions-through-bhim/ (last visited June 08, 2024)
Number of transactions done through BHIM in India from January 2017 to June 2023 (in millions) [Graph], NPCI, August 3, 2023. [Online]. Available: https://www.statista.com/statistics/1055414/india-number-of-transactions-through-bhim/