


What is FCP?
First Contentful Paint (FCP) measures the time from when the user first navigated to the page to when any part of the page's content is rendered on the screen. For this metric, "content" refers to text, images (including background images), <svg> elements, or non-white <canvas> elements.
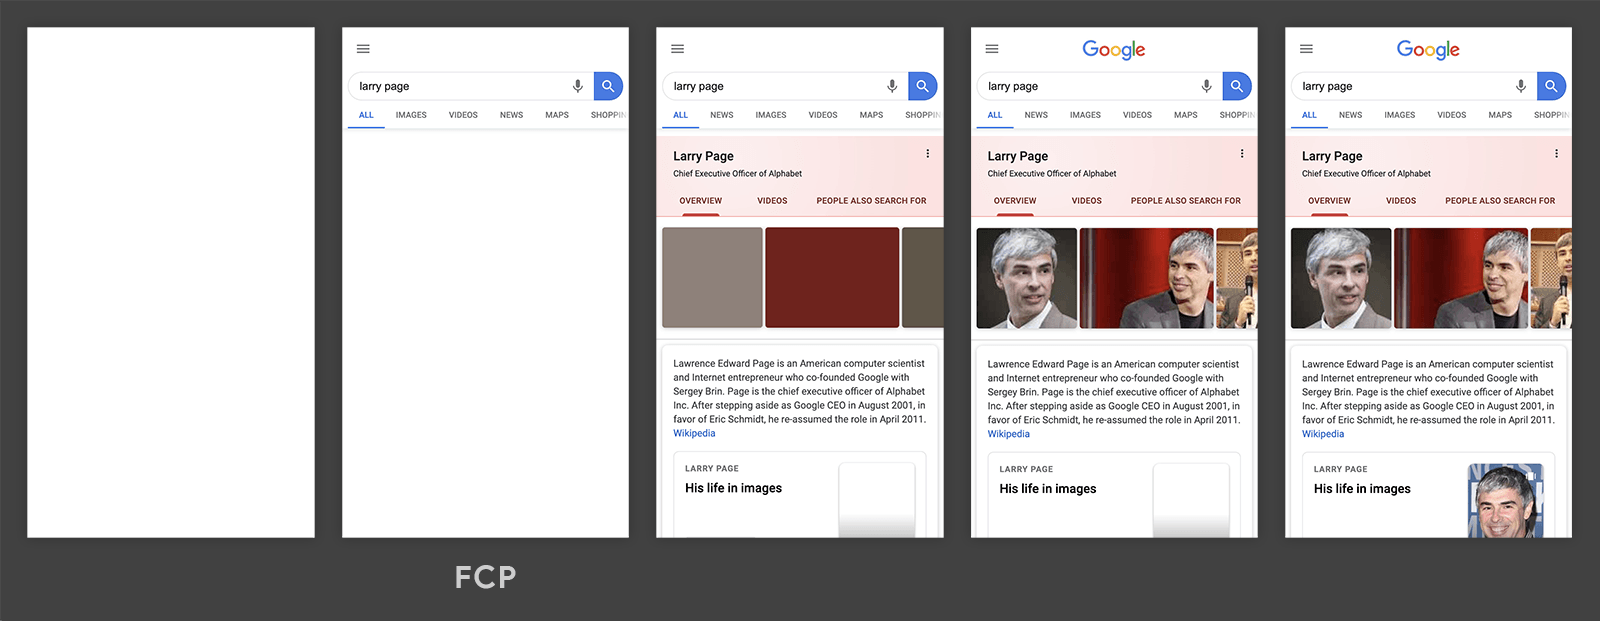
In the loading timeline depicted in the preceding image, FCP happens in the second frame, as that's when the first text and image elements are rendered to the screen.
You'll notice that though some of the content has rendered, not all of it has rendered. This is an important distinction to make between First Contentful Paint and Largest Contentful Paint (LCP)—which aims to measure when the page's main contents have finished loading.
What is a good FCP score?
To provide a good user experience, sites should strive to have a First Contentful Paint of 1.8 seconds or less. To ensure you're hitting this target for most of your users, a good threshold to measure is the 75th percentile of page loads, segmented across mobile and desktop devices.

How to measure FCP
FCP can be measured in the lab or in the field, and it's available in the following tools:
Field tools
- PageSpeed Insights
- Chrome User Experience Report
- Search Console (Speed Report)
web-vitalsJavaScript library
Lab tools
Measure FCP in JavaScript
To measure FCP in JavaScript, you can use the Paint Timing API. The following example shows how to create a PerformanceObserver that listens for a paint entry with the name first-contentful-paint and logs it to the console.
new PerformanceObserver((entryList) => {
  for (const entry of entryList.getEntriesByName('first-contentful-paint')) {
    console.log('FCP candidate:', entry.startTime, entry);
  }
}).observe({type: 'paint', buffered: true});
In the previous code snippet, the logged first-contentful-paint entry will tell you when the first contentful element was painted. However, in some cases this entry is not valid for measuring FCP.
The following section lists the differences between what the API reports and how the metric is calculated.
Differences between the metric and the API
- The API will dispatch a
first-contentful-paintentry for pages loaded in a background tab, but those pages should be ignored when calculating FCP (first paint timings should only be considered if the page was in the foreground the entire time). - The API does not report
first-contentful-paintentries when the page is restored from the back/forward cache, but FCP should be measured in these cases since users experience them as distinct page visits. - The API may not report paint timings from cross-origin iframes, but to properly measure FCP you should consider all frames. Sub-frames can use the API to report their paint timings to the parent frame for aggregation.
- The API measures FCP from navigation start, but for prerendered pages FCP should be measured from
activationStartsince that corresponds to the FCP time as experienced by the user.
Rather than memorizing all these subtle differences, developers can use the web-vitals JavaScript library to measure FCP, which handles these differences for you (where possible—note the iframe issue is not covered):
import {onFCP} from 'web-vitals';

// Measure and log FCP as soon as it's available.
onFCP(console.log);
You can refer to the source code for onFCP() for a complete example of how to measure FCP in JavaScript.
How to improve FCP
To learn how to improve FCP for a specific site, you can run a Lighthouse performance audit and pay attention to any specific opportunities or diagnostics the audit suggests.
To learn how to improve FCP in general (for any site), refer to the following performance guides:
- Eliminate render-blocking resources
- Minify CSS
- Remove unused CSS
- Remove unused JavaScript
- Preconnect to required origins
- Reduce server response times (TTFB)
- Avoid multiple page redirects
- Preload key requests
- Avoid enormous network payloads
- Serve static assets with an efficient cache policy
- Avoid an excessive DOM size
- Minimize critical request depth
- Ensure text remains visible during webfont load
- Keep request counts low and transfer sizes small
Changelog
Occasionally, bugs are discovered in the APIs used to measure metrics, and sometimes in the definitions of the metrics themselves. As a result, changes must sometimes be made, and these changes can show up as improvements or regressions in your internal reports and dashboards.
To help you manage this, all changes to either the implementation or definition of these metrics will be surfaced in this Changelog.
If you have feedback for these metrics, you can provide it in the web-vitals-feedback Google group.