Explore the universe and discover our home planet with the official NASA Tumblr account
ALT
Deniz Burnham
A former NASA intern, Deniz Burnham started her career as an engineer on an oil rig in Prudhoe Bay, Alaska, and went on to lead operations on drilling rigs in Canada, Ohio, and Texas. https://go.nasa.gov/3wDpfBo
We transmit vast amounts of data from space, letting all of our satellites “phone home.” Imagery from far off regions of our solar system, beautiful visions of other galaxies and insights into planet Earth flow through our communications networks.
Our Space Communications and Navigation (SCaN) program is dedicated to making sure we precisely track, command and control our spacecraft. All the while, they develop bold new technologies and capabilities for Artemis – our sustainable lunar exploration program that will place the first woman and the next man on the Moon in 2024.
As we prepare to say goodbye to the 2010s, let’s take a look at 10 of the biggest milestones in space communications and navigation of the past decade.
1. Continuous global communications? TDRS has you covered.
From 2013 to 2017, we launched three Tracking and Data Relay Satellites, or TDRS for short. These new satellites replenished a fleet that has been around since the early 1980s, allowing us to provide continuous global communications coverage into the next decade. Missions like the International Space Station depend on TDRS for 24/7 coverage, allowing our astronauts to call home day or night.
2. Binge watching on the Moon? Laser communications will make it possible.
Imagine living at the Moon. With the Artemis program, we’re making it happen! However, we can’t live there without decent internet, right? In 2013, we conducted the Lunar Laser Communication Demonstration (LLCD). This was the first high-speed laser communications demonstration from the Moon, transmitting data at a whopping 622 megabits per second, which is comparable to many high-speed fiber-optic connections enjoyed at home on Earth! Our LLCD sent back high-definition video with no buffering.
3. Record Breaking GPS navigation, at your service.
Space communications is just one piece of the SCaN puzzle. We do navigation too! We even break records for it. In 2016, our Magnetospheric Multiscale (MMS) mission broke the world record for highest altitude GPS fix at 43,500 miles above Earth. In 2017, they broke it again at 93,200 miles. Earlier this year, they broke it a third time at 116,200 miles from Earth — about halfway to the Moon!
Thanks to MMS, our navigation engineers believe that GPS and similar navigation constellations could play a significant role in the navigation architecture of our planned Gateway spaceship in lunar orbit!
4. Crashing planes as part of the game – of research!
Then there was that one summer we crashed three planes in the name of research! In 2015, our Search and Rescue office tested crash scenarios at Langley Research Center’s Landing and Impact Research Facility to improve the reliability of emergency beacons installed in planes. After the study, we made recommendations on how pilots should install these life-saving beacons, increasing their chances of survival in the event of a crash. The Federal Aviation Administration adopted these recommendations this year!
5. The Deep Space Atomic Clock takes flight.
Missions venturing into deep space want the autonomy to make decisions without waiting for a commands from Earth. That’s why we launched the Deep Space Atomic Clock this past year. This itty-bitty technology demonstration is a small, ultra-stable timekeeping device that could enable autonomous navigation!
6. 50 never looked so good – for our Deep Space Network.
7. SCaN Testbed becomes an official Hall of Famer.
In 2012, we installed the SCaN Testbed, which looks like a blue box in the above picture, on the space station! We built the testbed out of Software Defined Radios, which can change their functionality and employ artificial intelligence. These radios will help us adapt to the increasingly crowded communications landscape and improve the efficiency of radio technology. The Testbed was so ground-breaking that it was inducted into the Space Technology Hall of Fame in 2019.
8. Moon mission communications system, secured!
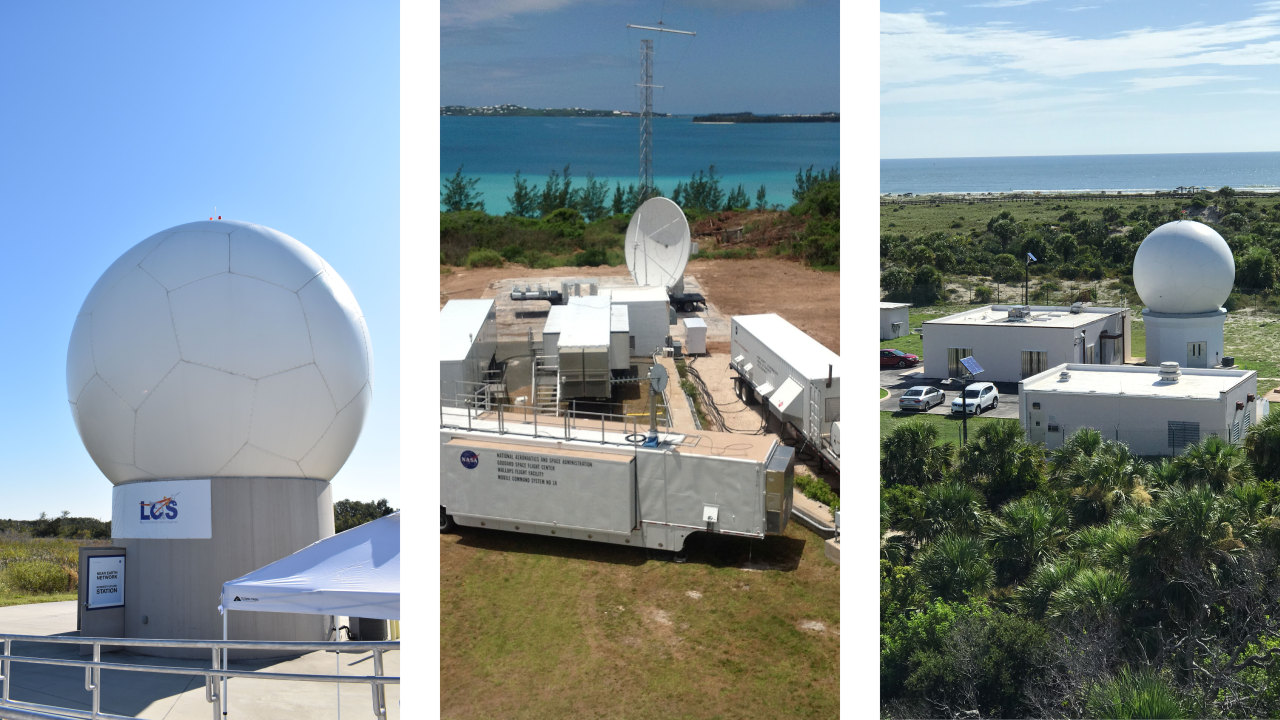
Just a few weeks ago, we held a ribbon-cutting for the Near Earth Network’s Launch Communications Segment, which will support Artemis missions as they rocket toward the Moon! During initial, dynamic phases of launch, the segment’s three stations will provide communications between astronauts and mission controllers, giving them the data necessary to ensure crew safety.
9. Deep Space Station antenna introduces “beam waveguide” technology.
On October 1, 2014, in Canberra, Australia, the Deep Space Network’s Deep Space Station 35 (DSS-35) antenna went operational. It was the first of a number of new antennas built to support the growing number of deep space missions! The antenna is different from other antennas that were built before it. Older antennas had a lot of their equipment stored high up on the antenna above the dish. DSS-35 uses “beam waveguide” technology that stores that equipment underground. This makes the weight sitting on the dish much lighter, cuts down on interference and makes the antenna much easier to operate and maintain.
10. Hello, Alaska!
Last — but certainly not least — we expanded our presence in the 49th state, Alaska! While this picture might look like antennas rising from the forests of Endor, the one in the foreground is actually an antenna we installed in 2014 in partnership with the University of Alaska Fairbanks. Because of its proximity to the polar north, this 11-meter beauty is uniquely situated to pull down valuable Earth science data from our polar-orbiting spacecraft, contributing to scientists’ understanding of our changing planet!
Make sure to follow us on Tumblr for your regular dose of space: http://nasa.tumblr.com.
From 2009 through 2019, our Operation IceBridge flew planes
above the Arctic, Antarctic and Alaska, measuring the height, depth, thickness,
flow and change of sea ice, glaciers and ice sheets.
IceBridge was designed to “bridge” the years between
NASA’s two Ice, Cloud, and land Elevation Satellites, ICESat and ICESat-2. IceBridge made its final
polar flight in November 2019, one year after ICESat-2’s successful launch.
A lot of amazing science happens in a decade of fundamentally
changing the way we see ice. Here, in chronological order, are 10 of
IceBridge’s most significant and exciting achievements.
2009: Go for
launch
The first ICESat monitored ice, clouds, atmospheric
particles and vegetation globally beginning in 2003. As ICESat neared the end
of its life, we made plans to keep measuring ice elevation with aircraft until
ICESat-2’s launch.
ICESat finished its service in August 2009, leaving
IceBridge in charge of polar ice tracking for the next decade.
2009: Snow on sea ice
To measure how thick sea ice is, we first have to know
how much snow is accumulated on top of the ice. Using a snow radar instrument,
IceBridge gathered the first widespread data set of snow thickness on top of
both Arctic and Antarctic sea ice.
2009: Getting to
the bottom of glaciers
IceBridge mapped hundreds of miles of grounding lines in
both Antarctica and Greenland. Grounding lines are where a glacier’s bottom
loses contact with the bedrock and begins floating on seawater – a grounding
line that is higher than rock that the ice behind it is resting on increases
the possibility of glaciers retreating in the future.
The team mapped 200 glaciers along Greenland’s coastal areas,
as well as coastal areas, the interior of the Greenland Ice Sheet and
high-priority areas in Antarctica.
2011: Spotting
cracks in the ice
While flying Antarctica in 2011, IceBridge scientists spotted
a massive crack in Pine Island Glacier, one of the fastest-changing
glaciers on the continent. The crack produced a new iceberg that October.
Pine Island has grown thinner and more unstable in recent
decades, spawning new icebergs almost every year. IceBridge watched for cracks
that could lead to icebergs and mapped features like the deep water
channel underneath Pine Island Glacier, which may bring warm water to its
underside and make it melt faster.
2013: Making a map
of rock
Using surface elevation, ice thickness and bedrock
topography data from ICESat, IceBridge and international partners, the British
Antarctic Survey created an updated map of the bedrock beneath Antarctic ice.
Taking gravity and magnetic measurements helps
scientists understand what kind of rock lies below the ice sheet. Soft rock and meltwater
make ice flow faster, while hard rock makes it harder for the ice to flow
quickly.
2013: Surprises
under the ice
IceBridge’s airborne radar data helped map the bedrock
underneath the Greenland Ice Sheet, revealing a previously unknown canyon
more than 400 miles long and up to a half mile deep slicing through the
northern half of the country.
The “grand canyon” of Greenland may have once been a
river system, and today likely transports meltwater from Greenland’s interior
to the Arctic Ocean.
2015: It’s what’s
inside (the ice sheet) that counts
After mapping the bedrock under the Greenland Ice Sheet,
scientists turned their attention to the middle layers of the ice. Using both
ice-penetrating radar and ice samples taken in the field, IceBridge created the
first map
of the ice sheet’s many layers, formed as thousands of years of snow became
compacted downward and formed ice.
Making the 3D map of Greenland’s ice layers gave us clues
as to how the ice sheet has warmed in the past, and where it may be frozen to
bedrock or slowly melting instead.
2018: Gap bridged!
ICESat-2 launched on September 15,
2018, rocketing IceBridge into the final phase of its mission: Connecting ICESat
and ICESat-2.
IceBridge continued flying after ICESat-2’s launch,
working to verify the new satellite’s measurements. By conducting precise
underflights, where planes traced the satellite’s orbit lines and took the same
measurements at nearly the same time, the science teams could compare results
and make sure ICESat-2’s instruments were functioning properly.
2018: An impact crater under the ice
Using IceBridge data, an international team of scientists
found an impact crater from a meteor thousands of years in the past. The crater
is larger than the city of Washington, D.C., likely created by a meteor more
than half a mile wide.
2019: Flying into
the sunset
In 2019, IceBridge continued flying in support of
ICESat-2 for its Arctic and Antarctic campaigns. The hundreds of terabytes of
data the team collected over the decade will fuel science for years to come.
IceBridge finished its last polar flight on November 20,
2019. The team will complete one more set of Alaska flights in 2020.
Each year since 2009,
geophysicist and
pilot Chris Larsen has led two sets of
flights to monitor Alaska’s mountain glaciers. From the air, scientists like
Larsen collect critical information on how the region’s snow and ice is
changing. They also are in a good position to snap photographs of the stunning
landscape. Larsen was flying with NASA science writer Maria-Jose Viñas on
board. During a flight on August 19, 2018, Viñas shot this photograph during a
mission to survey Yakutat Icefield and nearby glaciers in southeast Alaska.
The beach and stream in the photograph are in Russel Fjord near the terminus of
the Hubbard Glacier. While this photograph does not show any glaciers, evidence
of their presence is all around. Meltwater winds down a vegetation-free path of
glacial till. On its way toward open water, the stream cuts through a beach
strewn with icebergs.
“The Hubbard Glacier has a broad and active calving front providing a generous
supply of icebergs,” said Larsen, a researcher at the University of Alaska,
Fairbanks. “They are present all summer since new ones keep coming from the
glacier.”
NASA’s Operation IceBridge makes lengthy flights each year over the landmasses
of Greenland and Antarctica and their surrounding sea ice. While
IceBridge-Alaska flights are shorter in length, the terrain is equally majestic
and its snow and ice important to monitor. Wherever IceBridge flights are made,
data collection depends in part on weather and instruments.

 ALT
ALT