Anonymous asked:
What made you want to become a pilot for NASA? What’s your favorite part of this job?


Anonymous asked:
See more posts like this on Tumblr
#nasa #answertime #DeanNeeleyAT #Earth #earth science #air force #home planet #attitude #atmosphere #science #space #pilot #airplanes #flightlife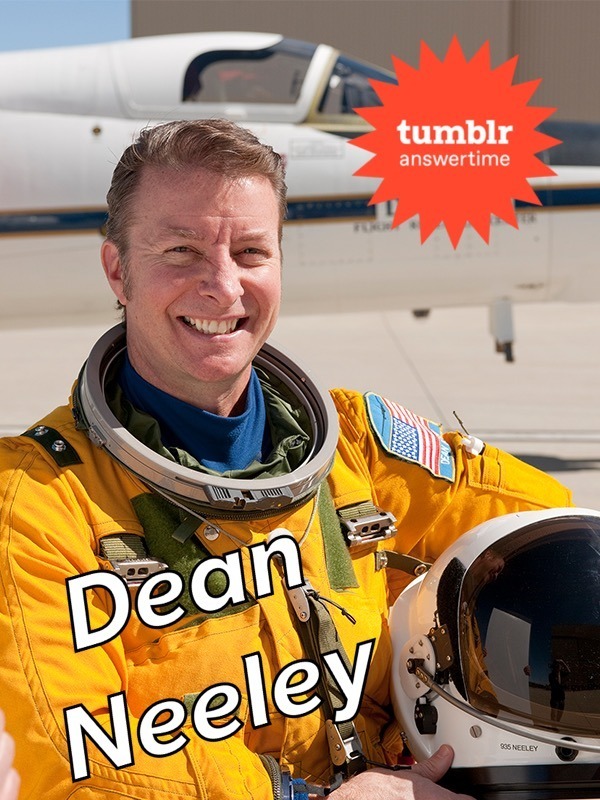
This January, we’re kicking off five new airborne Earth science expeditions aimed at studying our home planet from the land, sea and air. Here’s your chance to hear what it’s like from the cockpit!
Research pilot Dean “Gucci” Neeley will be taking your questions in an Answer Time session on Friday, January 10 from 12-1pm ET here on NASA’s Tumblr! Find out what it’s like to fly research aircraft that use the vantage point of space to increase our understanding of Earth, improve lives and safeguard our future! Make sure to ask your question now by visiting http://nasa.tumblr.com/ask!
Dean Neeley, retired U.S. Air Force officer and pilot, joined our Armstrong Flight Research Center in 2012 as a research pilot. Neeley flies a diverse array of highly modified airborne science, research and mission support aircraft such as the single-seat Lockheed ER-2 high-altitude science jet. The ER-2 collects information about Earth resources, celestial observations, atmospheric chemistry and dynamics and oceanic processes. Neeley has also flown the Gulfstream G-II mission support aircraft, which explores environmentally friendly aircraft concepts, the Stratospheric Observatory for Infrared Astronomy (SOFIA), which observes the solar system and beyond at mid- and far-infrared wavelengths, and the C-20A (G-III) science platform aircraft, which carries our Jet Propulsion Laboratory’s synthetic aperture radar.
Make sure to follow us on Tumblr for your regular dose of space: http://nasa.tumblr.com.
When you think about Earth Day, you might think about planting trees or picking up garbage. But right now, as a lot of us are staying inside to stay safe, we’ve got you covered for Earth Day at Home with ways to appreciate our beautiful home planet from your couch.
Our new NeMo-Net app lets you do that while playing a game!
Worldview lets you choose any location on Earth and see it the way our satellites do – in natural color, lit by electric lights at night, or in infrared, highlighting fires around the globe.
On April 22 – Earth Day – we’ll have a host of activities you can participate in. Scientists will share their research from their own homes, including messages from astronauts living on the International Space Station! Hear stories from a trip to Earth’s most remote location: Antarctica, including what happens when the chocolate goes missing on a weeks-long excursion. We’ll even have a new episode of NASA Science Live sharing some of what we’re doing to make our work more sustainable.

We’ll be sharing Earth Day from our homes with #EarthDayAtHome on Twitter, Instagram, Facebook and with a Tumblr Answer Time right here! Follow along, and participate, as we share our love for our home planet with you.
Make sure to follow us on Tumblr for your regular dose of space: http://nasa.tumblr.com.
We’re not just doing research in space! From the land, the sea and the sky, we study our planet up close. Right now, we’re gearing up for our newest round of Earth Expeditions, using planes, boats and instruments on the ground to study Earth and how it’s changing.

The newest round of campaigns takes place all across the United States – from Virginia to Louisiana to Kansas to California.
The five newest missions will combine measurements from the ground, the sea, air and space to investigate storms, sea level rise and processes in the atmosphere and ocean.
Let’s meet the newest Earth science missions:
The Investigation of Microphysics and Precipitation for Atlantic Coast-Threatening Snowstorms will start from Wallops Flight Facility in Virginia to understand how bands of snow form during winter storms in the East Coast. This research will help us better forecast intense snowfall during extreme winter weather.
Flying out of Langley Research Center, the Aerosol Cloud Meteorology Interactions over the Western Atlantic Experiment is studying how specific types of clouds over oceans affect Earth’s energy balance and water cycle. The energy balance is the exchange of heat and light from the Sun entering Earth’s atmosphere vs. what escapes back into space.
Farther south, Delta-X is flying three planes around the Mississippi River Delta to study how land is deposited and maintained by natural processes. Studying these processes can help us understand what will happen as sea levels continue to rise.

Heading out to the Midwest this summer, the Dynamics and Chemistry of the Summer Stratosphere mission will study how thunderstorms can carry pollutants from high in the atmosphere deep into the lower stratosphere, where they can affect ozone levels.

About 200 miles off the coast of San Francisco, the Sub-Mesoscale Ocean Dynamics Experiment is using ships, planes and gliders to study the impact that ocean eddies have on how heat moves between the ocean and the atmosphere.
These missions are kicking off in January, so stay tuned for our updates from the field! You can follow along with NASA Expeditions on Twitter and Facebook.
Make sure to follow us on Tumblr for your regular dose of space: http://nasa.tumblr.com.
It’s amazing what you can do with a little needle and thread! For #WorldEmbroideryDay, we asked what NASA imagery inspired you. You responded with a variety of embroidered creations, highlighting our different areas of study.
Here’s what we found:
 ALT
ALTWendy Edwards, a project coordinator with Earth Science Data Systems at NASA, created this embroidered piece inspired by Webb’s Carina Nebula image. Captured in infrared light, this image revealed for the first time previously invisible areas of star birth. Credit: Wendy Edwards, NASA. Pattern credit: Clare Bray, Climbing Goat Designs
Today we roll out a new communications project that highlights some of the many ways that NASA’s Earth observations help people strengthen communities across the United States.
Space for U.S. features stories on how Earth science data is used to make informed decisions about public health, disaster response and recovery and environmental protection. By highlighting advanced technology from a global perspective, our data helps provide people achieve groundbreaking insights.
For example, a family-owned coffee company in Maine used our sunlight, wind and temperature data to determine the placement of their power-generating solar wall.
Space for U.S. features 56 stories illustrating how our science has made an impact in every state in the nation as well as the District of Columbia, Puerto Rico and regions along the Atlantic, Pacific, Gulf of Mexico, and the Great Lakes.
For six decades, we’ve used the vantage point of space to better understand our home planet and improve lives. Using Space for U.S., you can browse through stories about how applied Earth science either by state or by topics such as animals, disasters, energy, health, land and water. Each click brings you a story about how people are putting NASA data to work.
Explore the true stories behind the innovative technology, groundbreaking insights, and extraordinary collaboration happening right here in the United States with Space for U.S.
Check out “Space for U.S.” today! www.nasa.gov/spaceforus
For more information on NASA Earth, head to www.nasa.gov/Earth or https://appliedsciences.nasa.gov.
Make sure to follow us on Tumblr for your regular dose of space: http://nasa.tumblr.com.

Dr. Erika Podest is a scientist with the Carbon Cycle and Ecosystems Group in our Jet Propulsion Laboratory’s Earth Science Division and Visiting Associate Researcher in the Joint Institute for Regional Earth System Science and Engineering (JIFRESSE) at UCLA. Her research entails using satellite images to study Earth’s ecosystems specifically related to wetlands and boreal forests and how they are being affected by climate change.
Erika took time from studying our home planet to answer questions about her life and career! Get to know our Earth Scientist:
I am inspired by the beauty of nature, its perfection and by the peace it brings me. My motivation is to make a positive impact on our planet by better understanding it and caring for it.
I was born and raised in Panama, which is a country with an exuberant nature. Since I can remember, I was always surrounded by nature because my father was an adventurer who loved the outdoors and always took me with him to go exploring or simply to enjoy a nice relaxing day outside. This led me to develop a deep sense of appreciation, respect, and curiosity for nature, which sparked my interest to learn about it and pursue a career in Earth Science.

Early in my college years I was training for my private pilot’s license and during my solo flights I would take pictures of features on the surface from the plane. I was always amazed at the details the pictures showed of the landscape that were not obvious from the ground. This was the first step towards discovering that there was a field for studying Earth from above, called remote sensing and consequently my Masters and Ph.D. were focused in this field.
I don’t think it is a matter of any one technology, discovery or policy. It is a combination of everything. Having an impact on climate change involves every level and direction, from the bottom up at the individual, grassroots and community level to the top down at the policy level. As individuals, I think it is important to educate ourselves about climate change (I suggest climate.nasa.gov). We all have the power to make a positive change by speaking up and making informed decisions about our consumptive habits.

Wetlands provide a vital role in carbon storage. Even though they cover about 5-8% of the Earth’s land surface, studies indicate that they contain a disproportionate amount of our planet’s total soil carbon, about 20-30%. In addition, they are like the arteries and veins of the landscape, acting as water sources and purifiers and helping in flood control. They also protect our shores and harbor large amounts of biodiversity.
Boreal forests are found in the uppermost northern hemisphere (Alaska, most of Canada, Russia, Scandinavia and northern Asia) and account for about 30% of the world’s forest cover. These forests lock up enormous amounts of carbon and help slow the increasing buildup of carbon dioxide in our atmosphere. In their peak growth phase during the northern spring and summer, the worldwide levels of carbon dioxide fall and the worldwide levels of oxygen rise.

It depends on the research trip. For example, one of my more recent ones was to the Peruvian Amazon where we went upriver on a boat for three weeks on a major tributary of the Amazon River called the Ucuyali River. I was with a team of eight researchers and we were studying the wetland ecosystems of the Pacaya-Samiria Natural Reserve, which entailed making vegetation measurements and assessing inundation extent to validate our scientific findings from satellite observations. We camped for most of the trip and a typical day entailed waking up at around 5:00 am with a symphony of sounds that emerged from the forest, including monkeys. We had breakfast and set off from base camp into the forest (~1 hour walk) to work an 8-9 hour day with a short lunch break (we had packed lunches) at noon. At the end of the day I’d be drenched in sweat, sunscreen, insect repellent, and dust and I’d bathe with water from the river, which was as brown as a milk chocolate bar. It was the most refreshing and cleansing feeling! The day would close with dinner followed with a discussion of the measurements to be collected the following day. Lights were out by 7:30 pm (which seemed like midnight) and I’d re-emerge myself into my tent in the dark tropical night surrounded by the sounds of the forest, until the next morning.
That it is important to be patient, humble and thankful.
Great question! I do not have any secrete skills or talents but I do have a couple of hobbies. I play the piano, though I am still a novice. I love windsurfing. It is an amazing feeling to skim over the water at fast speeds (I’m also an adrenaline junkie). Finally, I am fascinated by magic card tricks and whenever I have some free time I like to learn a new trick.
I enjoy constantly learning about our natural world and how it works. I also really enjoy communicating my work to students and to the general public. I find it especially rewarding when I can educate people and motivate students to consider careers in science.
Erika, thank you for your time and everything you do to keep our home planet safe!
Make sure to follow us on Tumblr for your regular dose of space: http://nasa.tumblr.com.
Studying our home planet is just as powerful as exploring what’s beyond it.
Surface Water and Ocean Topography (SWOT) is a joint mission developed by NASA and the French space agency Centre National d’Études Spatiales (CNES), with contributions from the Canadian Space Agency and the UK Space Agency. It will track water on more than 90% of Earth’s surface and help communities, scientists, and researchers better understand this finite and vital resource. And it’s launching this month!
An important part of predicting our future climate is determining at what point Earth’s ocean water slows down its absorption of the excess heat in the atmosphere and starts releasing that heat back into the air, where it could accelerate global warming. SWOT will provide crucial information about this global heat exchange between the ocean and the atmosphere, enabling researchers to test and improve future climate forecasts.
The satellite will also offer insights to improve computer models for sea level rise projections and coastal flood forecasting.
Data from SWOT will additionally help scientists, engineers, water managers, and others better monitor drought conditions in lakes and reservoirs and improve flood forecasts for rivers.
SWOT will measure the height of water in Earth’s lakes, rivers, reservoirs, and the ocean, giving scientists the ability to track the movement of water around the world.
SWOT’s eye in the sky will provide a truly global view of the water on more than 90% of Earth’s surface, enriching humankind’s understanding of how the ocean reacts to and influences climate change along with what potential hazards – including floods – lie ahead in different regions of the world.
Because everything is better in HD 😉, SWOT will view Earth’s ocean and freshwater bodies with unprecedented clarity compared to other satellites, much like a high-definition television delivers a picture far more detailed than older models. This means that SWOT will be able to “see” ocean features – like fronts and eddies – that are too small for current space-based instruments to detect. Those measurements will help improve researchers’ understanding of the ocean’s role in climate change.
Not only will the satellite show where – and how fast – sea level is rising, it will also reveal how coastlines around the world are changing. It will provide similar high-definition clarity for Earth’s lakes, rivers, and reservoirs, many of which remain a mystery to researchers, who aren’t able to outfit every water body with monitoring instruments.
As climate change accelerates the water cycle, more communities around the world will be inundated with water while others won’t have enough. SWOT data will be used to monitor drought conditions and improve flood forecasts, providing essential information to water management agencies, disaster preparedness agencies, universities, civil engineers, and others who need to track water in their local areas. SWOT data also will help industries, like shipping, by providing measurements of water levels along rivers, as well as ocean conditions, including tides, currents, and storm surges.
With its innovative technology and commitment to engaging a diverse community of people who plan to use data from the mission, SWOT is blazing a trail for future Earth-observing missions. SWOT’s data and the tools to support researchers in analyzing the information will be free and accessible. This will help to foster research and applications activities by a wide range of users, including scientists, resource managers, and others who in the past may not have had the opportunity to access this kind of information. Lessons learned from SWOT will lead to new questions and improvements for future missions, including our upcoming Earth System Observatory, a constellation of missions focused on studying key aspects of our home planet.
Keep track of the mission here. And make sure to follow us on Tumblr for your regular dose of space!
When we think about what makes a planet habitable, we’re often talking about water. With abundant water in liquid, gas (vapor) and solid (ice) form, Earth is a highly unusual planet. Almost 70% of our home planet’s surface is covered in water!
But about 97% of Earth’s water is salty – only a tiny amount is freshwater: the stuff humans, pets and plants need to survive.
Water on our planet is constantly moving, and not just geographically. Water shifts phases from ice to water to vapor and back, moving through the planet’s soils and skies as it goes.
That’s where our satellites come in.
Look at the Midwestern U.S. this spring, for example. Torrential rain oversaturated the soil and overflowed rivers, which caused severe flooding, seen by Landsat.
Our satellites also tracked a years-long drought in California. Between 2013 and 2014, much of the state turned brown, without visible green.
It’s not just rain. Where and when snow falls – and melts – is changing, too. The snow that falls and accumulates on the ground is called snowpack, which eventually melts and feeds rivers used for drinking water and crop irrigation. When the snow doesn’t fall, or melts too early, communities go without water and crops don’t get watered at the right time.
Even when water is available, it can become contaminated by blooms of phytoplankton, like cyanobacteria . Also known as blue-green algae, these organisms can make humans sick if they drink the water. Satellites can help track algae from space, looking for the brightly colored blooms against blue water.


Zooming even farther back, Earth’s blue water is visible from thousands of miles away. The water around us makes our planet habitable and makes our planet shine blue among the darkness of space.

Knowing where the water is, and where it’s going, helps people make better decisions about how to manage it. Earth’s climate is changing rapidly, and freshwater is moving as a result. Some places are getting drier and some are getting much, much wetter. By predicting droughts and floods and tracking blooms of algae, our view of freshwater around the globe helps people manage their water.
Make sure to follow us on Tumblr for your regular dose of space: http://nasa.tumblr.com.
We could talk all day about how our satellite data is crucial for Earth science…tracking ocean currents, monitoring natural disasters, soil mapping – the list goes on and on.
Our satellite data can be used to build businesses and commercial products – but finding and using this data has been a daunting task for many potential users because it’s been stored across dozens of websites.
Until now.
Our Technology Transfer program has just released their solution to make finding data easier, called The NASA Remote Sensing Toolkit (RST).

RST offers an all-in-one approach to finding and using our Earth Science data, the tools needed to analyze it, and software to build your own tools.
Before, we had our petabytes on petabytes of information spread out across dozens of websites – not to mention the various software tools needed to interpret the data.

Now, RST helps users find everything they need while having only one browser open.
Feeling inspired to innovate with our data? Here are just a few examples of how other companies have taken satellite data and turned it into products, known as NASA spinoffs, that are helping our planet today.
1. Bringing Landscape into Focus
We have a number of imaging systems for locating fires, but none were capable of identifying small fires or indicating the flames’ intensity. Thanks to a series of Small Business Innovation Research (SBIR) contracts between our Ames Research Center and Xiomas Technologies LLC, the Wide Area Imager aerial scanner does just that. While we and the U.S. Forest Service use it for fire detection, the tool is also being used by municipalities for detailed aerial surveillance projects.
2. Monitoring the Nation’s Forests with the Help of Our Satellites
Have you ever thought about the long-term effects of natural disasters, such as hurricanes, on forest life? How about the big-time damage caused by little pests, like webworms?
Our Stennis Space Center did, along with multiple forest services and environmental threat assessment centers. They partnered to create an early warning system to identify, characterize, and track disturbances from potential forest threats using our satellite data. The result was ForWarn, which is now being used by federal and state forest and natural resource managers.
3. Informing Forecasts of Crop Growth
Want to hear a corny story?
Every year Stennis teams up with the U.S. Department of Agriculture to host a program called Ag 20/20 to utilize remote sensing technology for operational use in agricultural crop management practices at the level of individual farms.
During Ag 20/20 in 2000, an engineering contractor developed models for using our satellite data to predict corn crop yield. The model was eventually sold to Genscape Inc., which has commercialized it as LandViewer. Sold under a subscription model, LandViewer software provides predictions of corn production to ethanol plants and grain traders.
4. Water Mapping Technology Rebuilds Lives in Arid Regions
No joking around here. Lives depend on the ability to find precious water in areas with little of it.
Using our Landsat satellite and other topographical data, Radar Technologies International developed an algorithm-based software program that can locate underground water sources. Working with international organizations and governments, the firm is helping to provide water for refugees and other people in drought-stricken regions such as Kenya, Sudan, and Afghanistan.
5. Satellite Maps Deliver More Realistic Gaming

Are you more of the creative type? This last entry used satellite data to help people really get into their gameplay.
When Electronic Arts (EA) decided to make SSX, a snowboarding video game, it faced challenges in creating realistic-looking mountains. The solution was our ASTER Global Digital Elevation Map, made available by our Jet Propulsion Laboratory, which EA used to create 28 real-life mountains from 9 different ranges for its award-winning game.
You can browse our Remote Sensing Toolkit at technology.nasa.gov.
Want to know more about future tutorial webinars on RST?
Follow our Technology Transfer Program on twitter @NASAsolutions for the latest updates.
Want to learn more about the products made by NASA technologies? Head over to spinoff.nasa.gov.
Sign up to receive updates about upcoming tutorials HERE.
Make sure to follow us on Tumblr for your regular dose of space: http://nasa.tumblr.com.
Earth is special. 🌎
It’s the only place in the universe that we know contains life. Celebrate its beauty by taking a look at these breathtaking images of our home planet.
Swirling white clouds, deep blue oceans, and multicolored landscapes come to life on the pages of our new photo essay “Earth,” a collection of dramatic images captured by satellites.
Make sure to follow us on Tumblr for your regular dose of space: http://nasa.tumblr.com.