
This document describes how you can use Cloud Monitoring to observe trends in your log data and to notify you when conditions you describe occur To provide Cloud Monitoring with data from your log data, Logging supports the following features:
You can generate custom metrics from your log entries. These metrics are called log-based-metrics. You can also create metric-based alerting policies to notify you when a log-based metric meets a condition. For more information, see Visualize log entry data with log-based metrics.
You can use alerting policies to monitor, in near real time, when a message appears in your log entries. These alerting policies are called log-based alerting policies. For more information, see Monitor individual log entries for messages.
You can write a SQL query in Log Analytics and create an alerting policy that monitors the results of the query. These alerting policies are called SQL-based alerting policies. For more information, see Monitor SQL query results.
SQL-based alerting policies is in Public Preview.
The rest of this document describes the differences between these three alerting policies, and provides information about authorization, costs, and limits.
Visualize log entry data with log-based metrics
When you want to monitor recurring events in your log data over time, use log-based metrics. Log-based metrics generate numeric data from your log data and they are suitable when you want to do any of the following:
- Count the occurrences of a message, like a warning or error, in your log data and receive a notification when the number of occurrences crosses a threshold.
- Observe trends in your data, like latency values in your log data, and receive a notification when the values change in an unacceptable way.
- Create charts to display the extracted numeric data.
Because log-based metrics generate numeric data from your log data, you can use these metrics in alerting policies and display them in charts. For information about creating alerting policies and charts for log-based metrics, see Configure notifications for log-based metrics.
Cloud Monitoring provides a set of predefined log-based metrics, and you can define your own. To see a list of the system-defined log-based metrics, click the following add_circle button:
User-defined log-based metrics
You can create log-based metrics to extract numeric data from your log data. User-defined log-based metrics calculate values from both included and excluded log entries.
By default, user-defined log-based metrics collect data from all log entries received by the Log Router in your Google Cloud project, but you can define log-based metrics that collect data from log entries routed to a specific log bucket.
- For information about defining and using project-level log-based metrics, see Using log-based metrics.
- For information about defining and using bucket-level log-based metrics, see Log-based metrics on log buckets.
If you define your own log-based metrics, you might incur charges. For more information about costs associated with metric ingestion, see Chargeable metrics.
Monitor individual log entries for messages
When you want to be notified anytime a specific message occurs in a log entry, use log-based alerting policies. Log-based alerting policies are useful for catching security-related events in log entries, like the following:
- You want to be notified when an event appears in an audit log; for example, a human user accesses the security key of a service account.
- Your application writes deployment messages to logs, and you want to be notified when a deployment change is logged.
Log-based alerting policies are useful for events that you expect to be both rare and important. You don't want to know about a trend or pattern; you want to know that something occurred.
Log-based alerting policies are defined in a project, and they scan a log entry when the following conditions are true:
- Billing is enabled.
- The log entry originates in a project.
Sinks in the project where the log entry originates, or in a project to which the log entry is routed, route the log entry to a log bucket.
For example, assume a log entry originates in project
A. If a log sink in projectAroutes the log entry to a log bucket, then log-based alerting policies defined in projectAscan the log entry.As a second example, assume a log entry originates in project
Xand that a log sink in projectXroutes the log entry to projectY. If a sink in projectYroutes the log entry to a log bucket, then log-based alerting policies defined in projectXand in projectYscan the log entry.
You can't use log-based alerting policies to monitor log entries that originate in folders, billing accounts, or organizations, or to monitor log entries that aren't stored in log buckets. If you create aggregated sinks, then these sinks might intercept a log entry and prevent it from being routed by the sinks in the project where the log entry originates.
For information about creating log-based alerting policies, see Configure log-based alerting policies.
Monitor SQL query results
You can configure alerting policies that use Log Analytics to run SQL queries on your log entry data. These types of alerting policies are effective when you want to get notified based on patterns that can't be evaluated by log-based alerting policies, such as complex patterns in log entries or aggregations of log data. For more information, see Monitor your SQL query results with an alerting policy.
Comparison of alerting options
This section compares alerting policies built on log-based metrics, log-based alerting policies, and SQL-based alerting policies.
Summary table
The following table summarizes the alerting techniques and provides links to additional information:
| Metric-based alerting policies | Log-based alerting policies | SQL-based alerting policies | More information |
|---|---|---|---|
| Based on metrics derived from log entries | Based on strings in individual log entries | Based on tables returned by SQL queries over log entries | Log-based metrics Log-based alerting SQL-based alerting |
| Used to notify you of trends over time | Used to notify you when a specific message appears in a log | Used to notify you of a pattern in a window of log entries | Log-based metrics Log-based alerting SQL-based alerting |
Calculated from
|
Match only included log entries | Calculated from log entries in a sliding window | Available log entries SQL-based alerting |
| Operate on metrics from all projects in the metrics scope of the scoping project | Operate on log entries that satisfy the following conditions:
|
Operate on log views which are accessible through linked datasets. The linked datasets can be in any project. | Metrics scope Linked datasets |
| Incident is created when the value of a metric meets a condition for a specified period | Incident is created each time a specific log entry matches a filter | Incident is created when the table of query results meets a condition | Incidents and notifications |
| Created and managed in Monitoring | Created in Logging; managed in Monitoring |
Created in Log Analytics; managed in Monitoring | Creating and managing alerting policies SQL-based alerting |
| Viewed in Monitoring | Viewed in Monitoring | Viewed in Monitoring | Viewing alerting policies |
| Can use any notification channel supported in Monitoring | Can use any notification channel supported in Monitoring | Can use any notification channel supported in Monitoring | Notification channels |
Available log entries
User-defined log-based metrics are calculated from all log entries received by the Logging API for the Google Cloud project, regardless of any inclusion filters or exclusion filters that may apply to the Google Cloud project. If you create an alerting policy based on a user-defined log-based metric, then the policy monitors data from all log entries.
System-defined log-based metrics are calculated only from log entries that have been stored in log buckets in the Google Cloud project. If a log has been explicitly excluded, then it isn't included in these metrics. If you create an alerting policy based on a system-defined log-based metric, then the policy monitors data only from included log entries.
Log-based alerting policies are defined in a project, and they scan a log entry when the following conditions are true:
- Billing is enabled.
- The log entry originates in a project.
Sinks in the project where the log entry originates, or in a project to which the log entry is routed, route the log entry to a log bucket.
For example, assume a log entry originates in project
A. If a log sink in projectAroutes the log entry to a log bucket, then log-based alerting policies defined in projectAscan the log entry.As a second example, assume a log entry originates in project
Xand that a log sink in projectXroutes the log entry to projectY. If a sink in projectYroutes the log entry to a log bucket, then log-based alerting policies defined in projectXand in projectYscan the log entry.
You can't use log-based alerting policies to monitor log entries that originate in folders, billing accounts, or organizations, or to monitor log entries that aren't stored in log buckets. If you create aggregated sinks, then these sinks might intercept a log entry and prevent it from being routed by the sinks in the project where the log entry originates.
SQL-based alerting policies query log views on log buckets. These log buckets must be upgraded to use Log Analytics and then linked to a BigQuery dataset. For more information about SQL-based alerting policies, see Monitor your SQL query results with an alerting policy.
Monitor metrics across multiple projects
You can monitor metrics from several projects by configuring a metrics scope. A metrics scope lists all the projects and accounts that it monitors. A scoping project hosts the metrics scope. The scoping project stores the alerting policies and other configurations that you create for the metrics scope. The scoping project for a metrics scope is the project selected by the Google Cloud console project picker.
Alerting policies based on log-based metrics, like alerting policies based on other metrics, work across all projects in the metrics scope of the scoping project.
The metrics scope isn't relevant to alerting policies based on log entries, like log-based and SQL-based policies.
For more information about metrics scopes, including multi-project metrics scopes, and about scoping projects, see the following:
Incidents and notifications
When the condition of an alerting policy is met, Monitoring opens an incident and sends notifications to the notification channels of the alerting policy. To see the details of the incident, click View incident in the notification message, or navigate directly to the Incidents page in Monitoring.
Incidents for metric-based alerting policies
Alerting policies based on log-based metrics create incidents and notifications like all other metric-based alerting policies in Monitoring, as described in Alerting behavior. For more information about managing incidents for metric-based alerting policies, see Incidents for metric-based alerting policies.
Incidents for log-based alerting policies
Log-based alerting policies aren't metric-based alerting policies. When a log entry meets the condition of a log-based alerting policy, Monitoring creates incidents and notifications as follows:
The first time Cloud Logging writes a log entry that matches your alert query to a log bucket, an incident is created, and a notification is sent. If another matching log entry is then written, then a new incident is created only if the previous incident has been closed. However, it might take up to three minutes for a closed incident to be purged. When a matching log entry is received in the three minutes after you closed an incident, the system might reopen that incident rather than creating a new incident.
When you create a log-based alerting policy, you can specify the minimum time between notifications. For example, you select 10 minutes as the time between notifications. If the condition of your log-based alerting policy is met twice within that period, then you receive only one notification.
The maximum rate of incidents for log-based alerting policies is 1 incident every 5 minutes. If the query of your log-based alerting policy extracts label values, then each combination of extracted values represents its own incident timeline. For example, assume a log-based alerting policy extracts the values of a label and that the label can have two values. With this configuration, two incidents can be opened, one for each label value, in the same 5 minutes.
There is a limit of 20 incidents a day for each log-based alerting policy. If you reach this limit, then your notification includes a message that you have reached the limit for the day.
Incidents automatically close when the auto-close duration expires. By default, the auto-close duration is 7 days.
The auto-close duration specifies the time that must elapse, without a repeat of the cause of the incident, before the incident closes. For this reason, when an incident is open and its cause reoccurs, the incident can stay open longer than the auto-close duration.
For more information about managing incidents for log-based alerting policies, see Manage incidents for log-based alerting policies.
Incidents for SQL-based alerting policies
For SQL-based alerting policies, Cloud Monitoring creates an incident the first time the result of the SQL query meets the condition specified in the policy. Each alerting policy has only one open incident. While the incident is open, if the condition is met again, Monitoring doesn't create further incidents or send additional notifications. Monitoring closes SQL-based incidents after seven days, unless you configure a shorter incident closure period or close the incident on your own.
For more information about managing incidents for SQL-based alerting policies, see Manage incidents for SQL-based alerting policies.
Creating and managing alerting policies
You create, modify, and delete alerting policies based on log-based metrics in Cloud Monitoring, like any other metric-based alerting policy. For more information, see Managing policies.
You can create log-based alerting policies by using the Logs Explorer or the Cloud Monitoring API. You modify and delete log-based alerting policies in Monitoring or with the Cloud Monitoring API. For more information, see Managing log-based alerting policies.
You can create SQL-based alerting policies by using Log Analytics or the Cloud Monitoring API. You modify and delete SQL-based alerting policies in Monitoring or by using the Cloud Monitoring API. For more information, see Monitor your SQL query results with an alerting policy.
Viewing alerting policies
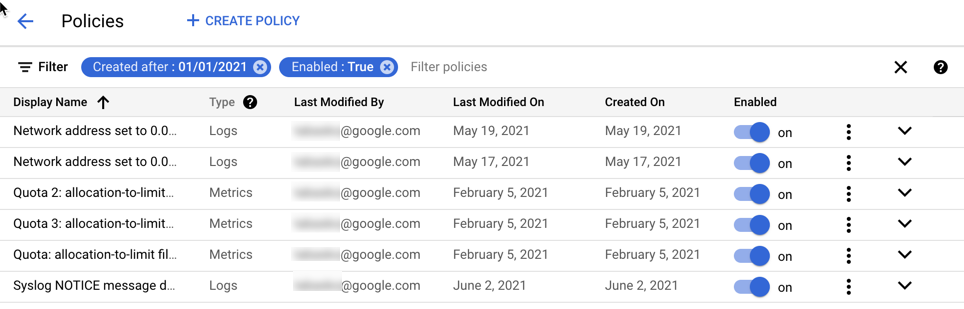
The Policies page in Monitoring lists all the alerting policies in your Google Cloud project. This list includes policies that use log-based metrics and log-based alerting policies.
-
In the Google Cloud console, go to the notifications Alerting page:
If you use the search bar to find this page, then select the result whose subheading is Monitoring.
- Select See all policies.
Log-based alerting policies appear in the list with the value Logs in the
Type column. Alerting policies based on metrics, including log-based
metrics, appear in the list with the value Metrics in the Type column.
SQL-based alerting policies appear in the
list with the value SQL in the Types column.
The following screenshot shows an excerpt of a policy list:
Notification channels
You can send notifications from any type of alerting policy to any of the notification channels supported by Monitoring. You must configure these channels before you can use them in alerting policies.
For more information, see Managing notification channels.
Authorization requirements
Using log-based metrics or log-based alerting policies requires authorization for both Cloud Logging and Cloud Monitoring.
For user-defined log-based metrics, see Permissions for log-based metrics.
For log-based alerting policies, see Permissions for log-based alerting policies.
For SQL-based alerting policies, see Permissions for SQL-based alerting policies.
Costs and limits
If you define your own log-based metrics, then the following apply:
- There are limits on the number and structure of user-defined log-based metrics. For more information about these limits, see limits for log-based metrics.
- You might incur charges for user-defined log-based metrics. For more information about costs associated with metric ingestion, see Chargeable metrics.
- SQL-based alerting policies run in a BigQuery reservation in your Google Cloud project. You might incur charges for having a BigQuery reservation. For more information about costs associated with BigQuery reservations, see BigQuery pricing.
There are no charges associated with using alerting policies based on log-based metrics.
The following Monitoring limits related to alerting policies apply:
| Category | Value | Policy type1 |
|---|---|---|
| Alerting policies (sum of metric and log) per metrics scope 2 | 500 | Metric, Log |
| Conditions per metric-based alerting policy | 6 | Metric |
| Conditions per SQL-based alerting policy (Public Preview) | 1 | SQL |
| Maximum query execution time for a SQL-based alerting policy (Public Preview) | 5 minutes | SQL |
| Maximum time period that a metric-absence condition evaluates3 |
1 day | Metric |
| Maximum time period that a metric-threshold condition evaluates3 |
23 hours 30 minutes | Metric |
| Maximum length of the filter used in a metric-threshold condition |
2,048 Unicode characters | Metric |
| Maximum number of time series monitored by a forecast condition |
64 | Metric |
| Minimum forecast window | 1 hour (3,600 seconds) | Metric |
| Maximum forecast window | 2.5 days (216,000 seconds) | Metric |
| Notification channels per alerting policy | 16 | All |
| Maximum rate of incidents4 for log-based alerts |
1 incident every 5 minutes | Log |
| Maximum number of incidents for log-based alerts |
20 incidents a day for each log-based alerting policy | Log |
| Maximum number of notifications per incident5 for log-based alerts |
20 notifications per day per incident | Log |
| Maximum number of simultaneously triggering alerting policies per project |
80,000 | All |
| Maximum number of simultaneously open incidents per alerting policy |
1,000 | All |
| Period after which an incident with no new data is automatically closed |
7 days | Metric, SQL |
| Maximum duration of an incident if not manually closed | 7 days | Log |
| Retention of closed incidents | 13 months | Not applicable |
| Retention of open incidents | Indefinite | Not applicable |
| Notification channels per metrics scope | 4,000 | Not applicable |
| Maximum number of alerting policies per snooze | 16 | All |
| Retention of a snooze | 13 months | Not applicable |
2Apigee and Apigee hybrid are deeply integrated with Cloud Monitoring. The alerting limit for all Apigee subscription levels—Standard, Enterprise, and Enterprise Plus—is the same as for Cloud Monitoring: 500 per metrics scope .
3The maximum time period that a condition evaluates is the sum of the alignment period and the duration window values. For example, if the alignment period is set to 15 hours, and the duration window is set 15 hours, then 30 hours of data is required to evaluate the condition.
4If the query of your log-based alerting policy extracts label values, then each combination of extracted values represents its own incident timeline. For example, assume a log-based alerting policy extracts the values of a label and that the label can have two values. With this configuration, two incidents can be created, one for each label value, in the same 5 minutes.
5For log-based alerts, Monitoring sends a new notification for an open incident when a log entry that matches the filter is received and at least 5 minutes has elapsed since the most recent notification. At most 20 notifications per day per incident are sent. Each notification is sent to all configured notification channels for the alerting policy.