
Intelligent insights (preview)
 Microsoft Cloud for Sustainability
Important
Some or all of this functionality is available as part of a preview release. The content and the functionality are subject to change.
Intelligent insights are generated by an AI model in Microsoft Sustainability Manager. The AI model allows you to perform a deeper analysis on your calculated and precalculated emissions data through outlier, trend, and correlation insights. Model runs occur monthly on the entirety of the All emissions table. You can schedule them for any day between the first and the 28th of the month through Settings.
Note
Intelligent insights (preview) is available in Microsoft Sustainability Manager Premium. For more information about plans, go to Microsoft Sustainability Manager plans.
View insights
To view intelligent insights:
In Sustainability Manager, in the Analytics area, select Intelligent insights (preview).
Select one of the following intelligent insights tabs:
Outliers
An outlier represents a record that shows a significant difference from others within the same context. It helps you discover data quality issues or areas where action is needed. The following image shows more details on outlier subtypes.

Time series: Time series outliers show you outliers in the time series data in various contexts after aggregating the data monthly. They also show the rolling mean of the series and the expected range for the series to help provide more context about why specific datapoints were detected as outliers.

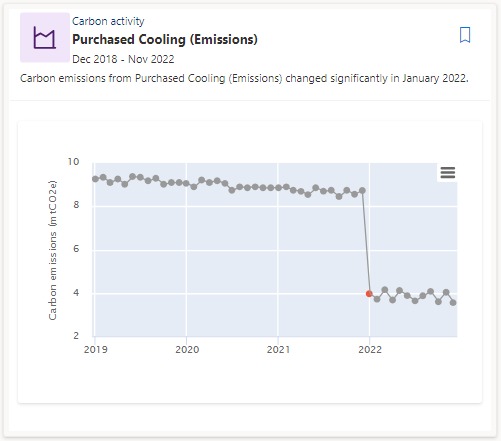
Change point: A change point is a sudden jump or drop in the data. It can result from data quality issues, missing data, or not ingesting data regularly.
Contribution: Contribution outliers highlight areas where an individual entity contributes a significant portion of the emissions compared to other entities in the same context.


Trends
A trend is the distinctive direction of your data over time. A consistent increase or decrease could help you identify an area that’s improving or needs attention.

In addition to regular trends such as the one in this image, there are also anomalous trends. When many trends are detected in the data, they're analyzed collectively to see if there are any anomalous trends that have increased or decreased significantly faster than other trends.
Note
For outlier trends, the Y-axis reflects the percentage change in mtCO2e for each entity since the beginning of the period highlighted in the insight.
Correlations
A correlation shows a significant data relationship across contexts, helping you predict an outcome or identify a link between two or more conditions.

Find the insights that matter most
You can find the insights that matter most to you by sorting, filtering, or bookmarking insights.
On the Outliers, Trends, or Correlations page, select one of the following actions:
Sort: The overall score, or significance, is based on three subscores: statistical significance as calculated by the algorithm, impact score, and relevance score. The impact score is a percentage of the emissions involved in an insight to the overall emissions of your organization. The relevance score is a set of heuristics that we predefined to rank the insights. Relevance might change over time based on customer feedback we receive.
Filter: Find the insights that matter most to you by filtering up or down by facility, date range, carbon activities, organizational unit, and/or country/region. You can layer filters for more fine-tuned results.
Bookmark: When an insight is interesting, important, or you just want to maintain it for later viewing, you can bookmark it. Unlike all other insights, bookmarked insights are maintained from one model run to another. To view your bookmarked insights, select the Bookmark tab.
Schedule a model run
Model runs occur once a month on your entire All emissions table, dating back at most four years. When new insights are generated, any prior insights that haven't been bookmarked are deleted.
You need admin-level access to change the day of the month on which the model runs.
In Sustainability Manager, select the Settings area.
In the left navigation under App settings, select General.
Select the Insights (preview) tab.
In the dropdown box, select the day of the month for the model run, and then select Save.


Note
The model will begin running at 00:00 UTC on the day chosen.
FAQs
For information about issues you might have with intelligent insights, review the following frequently asked questions (FAQs).
Why can't I sort trend and correlation insights by date?
Trend and correlation insights are built on aggregated data over time, going as far back as four years into the historical data. We recommend sorting by significance or applying filters in order to drill down further into your data.
Why don't insights display after the model completes a run?
If the model completes a run successfully but returns no insights, there might not be enough carbon emissions data in your environment to do so.
Why don't all tabs display insights after the model completes a run?
Depending on the type and quantity of data you have, there might not always be insights of every type. As you import more data, you'll be more likely to see all three insight types after the model has completed its monthly run.

