

1. Introduction

Last Updated: 2021-03-05
Observability of the application
Observability and OpenTelemetry
Observability is the term used to describe an attribute of a system. A system with observability allows teams to actively debug their system. In that context, three pillars of observability; logs, metrics, and traces are the fundamental instrumentation for the system to acquire observability.
OpenTelemetry is a set of specifications and SDKs that accelerates the instrumentation and export of telemetry data (logs, metrics, and traces) that observability requires. OpenTelemetry is an open standard and community driven project under CNCF. By utilizing libraries that the project and its ecosystem provide, developers are able to instrument their applications in the vendor neutral way and against multiple architectures.
Distributed Trace
Among logs, metrics, and traces, trace is the telemetry that tells the latency of a specific part of the process in the system. Especially in the era of microservices, distributed trace is the strong driver to find out latency bottlenecks in the overall distributed system.
When analysing distributed traces, the trace data visualization is the key to grasp overall system latencies at a glance. In distributed trace, we handle a set of calls to process a single request to the system entrypoint in a form of Trace containing mulitple Spans.
Span represents an individual unit of work done in a distributed system, recording start and stop times. Spans often have hierarchical relationships between each other - in the picture below all smaller spans are child spans of a large /messages span, and are assembled into one Trace that shows the path of work through a system.

Google Cloud Trace is one of the options for distributed trace backend and it is well integrated with other products in Google Cloud.
What you'll build
In this codelab, you're going to instrument trace information in the services called "Shakesapp" that runs on a Kubernetes cluster running on Google Kubernetes Engine. The architecture of Shakesapp is as described below:
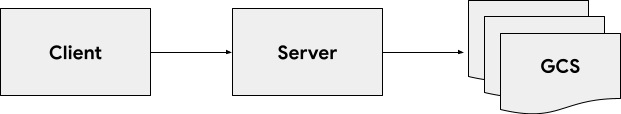
- Clients sends a query string to the server
- Server accepts the query from the client, fetches all Shakespare works in text format from Google Cloud Storage, searches the lines that contain the query and return the number of the line that matched to the client.
You will instrument the trace information across the request.
What you'll learn
- How to get started with the OpenTelemetry Trace libraries in Python project
- How to create a span with the library
- How to propagate span contexts across the wire between app components
- How to send trace data to Google Cloud Trace
- How to analyse the trace on Google Cloud Trace
This codelab explains how to instrument your microservices. To make it easy to understand, this example only contains 3 components (load generator, client, and server), but you can apply the same process explained in this codelab to more complex and large systems.
What you'll need
- Knowledge of Python 3
2. Setup and Requirements
Self-paced environment setup
If you don't already have a Google Account (Gmail or Google Apps), you must create one. Sign-in to Google Cloud Platform console ( console.cloud.google.com) and create a new project.
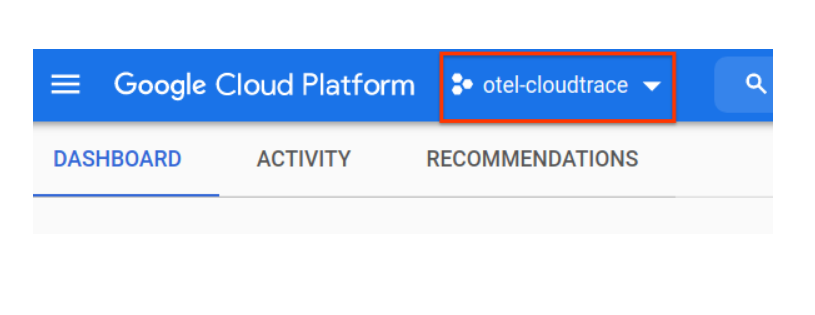
If you already have a project, click on the project selection pull down menu in the upper left of the console:
and click the ‘NEW PROJECT' button in the resulting dialog to create a new project:

If you don't already have a project, you should see a dialog like this to create your first one:

The subsequent project creation dialog allows you to enter the details of your new project:
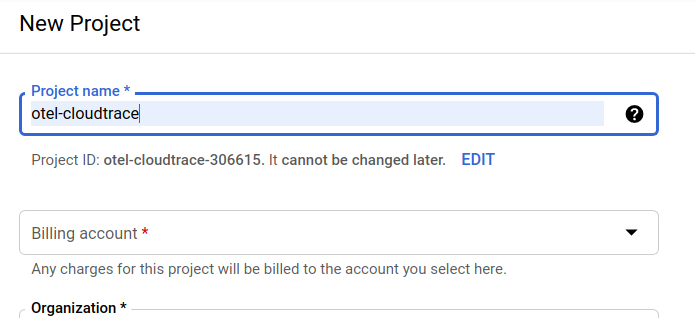
Remember the project ID, which is a unique name across all Google Cloud projects (the name above has already been taken and will not work for you, sorry!). It will be referred to later in this codelab as PROJECT_ID.
Next, if you haven't already done so, you'll need to enable billing in the Developers Console in order to use Google Cloud resources and enable the Cloud Trace API.

Running through this codelab shouldn't cost you more than a few dollars, but it could be more if you decide to use more resources or if you leave them running (see "cleanup" section at the end of this document). Pricings of Google Cloud Trace, Google Kubernetes Engine and Google Artifacat Registry are noted on the official documentation.
- Pricing for Google Cloud Observability
- Pricing | Kubernetes Engine Documentation
- Artifact Registry Pricing | Artifact Registry documentation
New users of Google Cloud Platform are eligible for a $300 free trial, which should make this codelab entirely free of charge.
Google Cloud Shell Setup
While Google Cloud and Google Cloud Trace can be operated remotely from your laptop, in this codelab we will be using Google Cloud Shell, a command line environment running in the Cloud.
This Debian-based virtual machine is loaded with all the development tools you'll need. It offers a persistent 5GB home directory and runs in Google Cloud, greatly enhancing network performance and authentication. This means that all you will need for this codelab is a browser (yes, it works on a Chromebook).
To activate Cloud Shell from the Cloud Console, simply click Activate Cloud Shell  (it should only take a few moments to provision and connect to the environment).

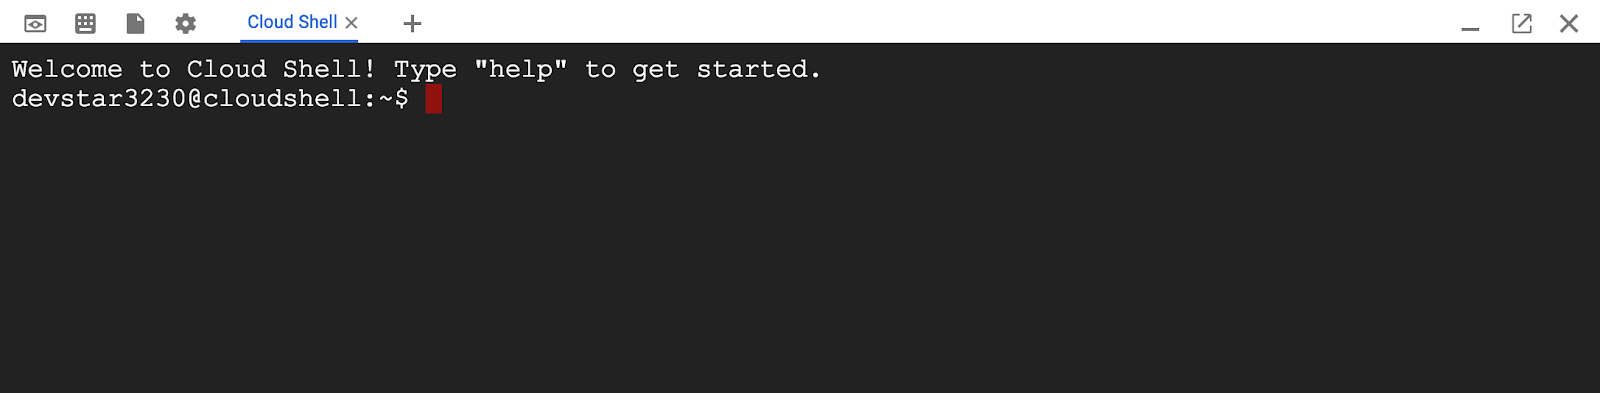
Once connected to Cloud Shell, you should see that you are already authenticated and that the project is already set to your PROJECT_ID.
gcloud auth list
Command output
Credentialed accounts:
 - <myaccount>@<mydomain>.com (active)
gcloud config list project
Command output
[core]
project = <PROJECT_ID>
If, for some reason, the project is not set, simply issue the following command:
gcloud config set project <PROJECT_ID>
Looking for your PROJECT_ID? Check out what ID you used in the setup steps or look it up in the Cloud Console dashboard:

Cloud Shell also sets some environment variables by default, which may be useful as you run future commands.
echo $GOOGLE_CLOUD_PROJECT
Comand output
<PROJECT_ID>
Finally, set the default zone and project configuration.
gcloud config set compute/zone us-central1-f
You can choose a variety of different zones. For more information, see Regions & Zones.
Python setup
In this codelab, we use "poetry" to manage package versions strictly. Run the following command on Cloud Shell:
curl -sSL https://raw.githubusercontent.com/python-poetry/poetry/master/get-poetry.py | python3 -
source $HOME/.poetry/env
Setup a Google Kubernetes Cluster
In this codelab, you will run a cluster of microservices on Google Kubernetes Engine (GKE). The process of this codelab is as the following:
- Download the baseline project into Cloud Shell
- Build microservices into containers
- Upload containers onto Google Artifact Registry (GAR)
- Deploy containers onto GKE
- Modify the source code of services for trace instrumentation
- Go to step2
Enable Kubernetes Engine
First, we set up a Kubernetes cluster where Shakesapp runs on GKE, so we need to enable GKE. Navigate to the menu "Kubernetes Engine" and press ENABLE button.

Now you are ready to create a Kubernetes cluster.
Create Kubernetes cluster
On Cloud Shell, run the following command to create a Kubernetes cluster. Please confirm the zone value is under the region that you have used for Artifact Registry repository creation. Change the zone value us-central1-f if your repository region is not covering the zone.
gcloud container clusters create otel-trace-codelab --zone us-central1-f \
--num-nodes 1 \
--machine-type e2-highcpu-4
Command output
Creating cluster otel-trace-codelab in us-central1-f... Cluster is being health-checked (master is healthy)...done.
Created [https://container.googleapis.com/v1/projects/psychic-order-307806/zones/us-central1-f/clusters/otel-trace-codelab].
To inspect the contents of your cluster, go to: https://console.cloud.google.com/kubernetes/workload_/gcloud/us-central1-f/otel-trace-codelab?project=psychic-order-307806
kubeconfig entry generated for otel-trace-codelab.
NAME                LOCATION       MASTER_VERSION    MASTER_IP        MACHINE_TYPE  NODE_VERSION      NUM_NODES  STATUS
otel-trace-codelab  us-central1-f  1.18.12-gke.1210  104.154.162.176  e2-medium     1.18.12-gke.1210  3          RUNNING
Artifact Registry and skaffold setup
Now we have a Kubernetes cluster ready for deploy. Next we prepare for an container registry for push and deploy containers. For these step, we need to set up GAR and skaffold to use it.
Artifact Registry setup
Navigate to the menu of "Artifact Registry" and press the ENABLE button.

After some moments, you will see the repository browser of GAR. Click "CREATE REPOSITORY" button and enter the name of repository.

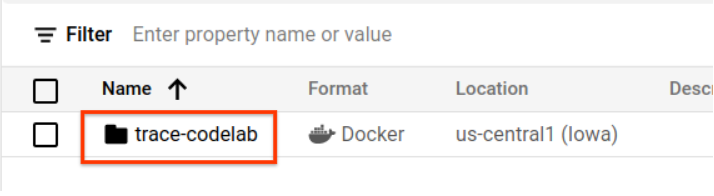
In this codelab, I name the new repository trace-codelab. The format of artifact is "Docker" and location type is "Region". Choose the region close to the one you set for Google Compute Engine default zone. For example, this example chose "us-central1-f" above, so here we choose "us-central1 (Iowa)". Then click the "CREATE" button.

Now you see "trace-codelab" on the repository browser.
We will come back here later to check the registry path.
Skaffold setup
Skaffold is handy tool when you work on building microservices runs on Kubernetes. It handles the workflow of building, pushing and deploying containers of applications with small set of commands. Skaffold by default uses Docker Registry as container registry, so you need to configure skaffold to recognize GAR on pushing containers to.
Open Cloud Shell again and confirm if skaffold is installed. (Cloud Shell installs skaffold into the environment by default.) Run the following command and see the skaffold version.
skaffold version
Command output
v1.20.0
Now, you can register the default repository for skaffold to use. In order to obtain the registry path, navigate yourself to Artifact Registry dashboard and click the name of repository you just set up in the previous step.

Then you will see breadcrumbs trails on the top of the page. Click  icon to copy the registry path to the clipboard.
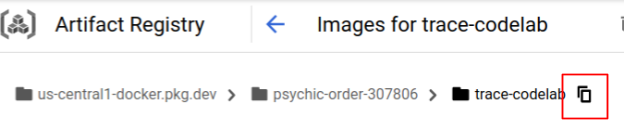
On clicking the copy button, you see the dialog at the bottom of the browser with the message like:
"us-central1-docker.pkg.dev/psychic-order-307806/trace-codelab" has been copied
Go back to the cloud shell. Run skaffold config set default-repo command with the value you just copied from the dashboard.
skaffold config set default-repo us-central1-docker.pkg.dev/psychic-order-307806/trace-codelab
Command output
set value default-repo to us-central1-docker.pkg.dev/psychic-order-307806/trace-codelab for context gke_stackdriver-sandbox-3438851889_us-central1-b_stackdriver-sandbox
Also, you need to configure the registry to Docker configuration. Run the following command:
gcloud auth configure-docker us-central1-docker.pkg.dev --quiet
Command output
{
  "credHelpers": {
    "gcr.io": "gcloud",
    "us.gcr.io": "gcloud",
    "eu.gcr.io": "gcloud",
    "asia.gcr.io": "gcloud",
    "staging-k8s.gcr.io": "gcloud",
    "marketplace.gcr.io": "gcloud",
    "us-central1-docker.pkg.dev": "gcloud"
  }
}
Adding credentials for: us-central1-docker.pkg.dev
Now you are good to go for the next step to set up a Kubernetes container on GKE.
Summary
In this step, you set up your codelab environment:
- Set up Cloud Shell
- Created a Artifact Registy repository for the container registry
- Set up skaffold to use the container registry
- Created a Kubernetes cluster where the codelab microservices run
Next up
In next step, you will build, push and deploy your microservices onto the cluster
3. Build, push and deploy the microservices
Download the codelab material
In previous step, we have set up all prerequisites for this codelab. Now you are ready to run whole microservices on top of them. The codelab material is hosted on GitHub, so download them to the Cloud Shell environment with the following git command.
cd ~
git clone https://github.com/GoogleCloudPlatform/opentelemetry-trace-codelab-python.git
The directory structure of the project is as the followings:
shakesapp-python
├── LICENSE
├── manifests
│   ├── client.yaml
│   ├── loadgen.yaml
│   └── server.yaml
├── proto
│   └── shakesapp.proto
├── skaffold.yaml
└── src
    ├── client
    ├── loadgen
    └── server
- manifests: Kubernetes manifest files
- proto: proto definition for the communication between client and server
- src: directories for the source code of each searvices
- skaffold.yaml: Configuration file for skaffold
Run skaffold command
Finally you are ready to build, push and deploy whole content onto the Kubernetes cluster you have just created. This sounds containing multiple steps but the actual is skaffold does everything for you. Let's try that with the following command:
cd shakesapp-python
skaffold run --tail
As soon as running the command, you see the log output of docker build and can confirm that they are successfully pushed to the registry.
Command output
...
---> Running in c39b3ea8692b
 ---> 90932a583ab6
Successfully built 90932a583ab6
Successfully tagged us-central1-docker.pkg.dev/psychic-order-307806/trace-codelab/serverservice:step1
The push refers to repository [us-central1-docker.pkg.dev/psychic-order-307806/trace-codelab/serverservice]
cc8f5a05df4a: Preparing
5bf719419ee2: Preparing
2901929ad341: Preparing
88d9943798ba: Preparing
b0fdf826a39a: Preparing
3c9c1e0b1647: Preparing
f3427ce9393d: Preparing
14a1ca976738: Preparing
f3427ce9393d: Waiting
14a1ca976738: Waiting
3c9c1e0b1647: Waiting
b0fdf826a39a: Layer already exists
88d9943798ba: Layer already exists
f3427ce9393d: Layer already exists
3c9c1e0b1647: Layer already exists
14a1ca976738: Layer already exists
2901929ad341: Pushed
5bf719419ee2: Pushed
cc8f5a05df4a: Pushed
step1: digest: sha256:8acdbe3a453001f120fb22c11c4f6d64c2451347732f4f271d746c2e4d193bbe size: 2001
After the push of all service containers, Kubernetes deployments starts automatically.
Command output
sha256:b71fce0a96cea08075dc20758ae561cf78c83ff656b04d211ffa00cedb77edf8 size: 1997
Tags used in deployment:
 - serverservice -> us-central1-docker.pkg.dev/psychic-order-307806/trace-codelab/serverservice:step4@sha256:8acdbe3a453001f120fb22c11c4f6d64c2451347732f4f271d746c2e4d193bbe
 - clientservice -> us-central1-docker.pkg.dev/psychic-order-307806/trace-codelab/clientservice:step4@sha256:b71fce0a96cea08075dc20758ae561cf78c83ff656b04d211ffa00cedb77edf8
 - loadgen -> us-central1-docker.pkg.dev/psychic-order-307806/trace-codelab/loadgen:step4@sha256:eea2e5bc8463ecf886f958a86906cab896e9e2e380a0eb143deaeaca40f7888a
Starting deploy...
 - deployment.apps/clientservice created
 - service/clientservice created
 - deployment.apps/loadgen created
 - deployment.apps/serverservice created
 - service/serverservice created
Caution: If you get the error like "No push access to specified image repository", check whether skaffold command is trying to push images to Docker Hub (docker.io) regardless of your configuration on default repo in skaffold. In that case, try adding "–default-repo" option to "skaffold run" like below.
$ skaffold run –tail –default-repo=us-central1-docker.pkg.dev/[project ID]/[repository name]
After the deployment, you'll see the actual application logs emitted to stdout in each containers like this:
Command output
[server] {"event": "starting server: 0.0.0.0:5050", "severity": "info", "timestamp": "2021-03-17T05:25:56.758575Z"}
[client] [2021-03-17 05:25:54 +0000] [1] [INFO] Starting gunicorn 20.0.4
[client] [2021-03-17 05:25:54 +0000] [1] [INFO] Listening at: http://0.0.0.0:8080 (1)
[client] [2021-03-17 05:25:54 +0000] [1] [INFO] Using worker: threads
[client] [2021-03-17 05:25:54 +0000] [7] [INFO] Booting worker with pid: 7
[client] {"event": "server address is serverservice:5050", "severity": "info", "timestamp": "2021-03-17T05:25:54.888627Z"}
[client] {"event": "request to server with query: world", "severity": "info", "timestamp": "2021-03-17T05:26:11.550923Z"}
[server] {"event": "query: world", "severity": "info", "timestamp": "2021-03-17T05:26:11.567048Z"}
[loadgen] {"event": "check connectivity: http://clientservice:8080/_healthz", "severity": "info", "timestamp": "2021-03-17T05:26:11.533605Z"}
[loadgen] {"event": "/_healthz response: ok", "severity": "info", "timestamp": "2021-03-17T05:26:11.544267Z"}
[loadgen] {"event": "confirmed connection ot clientservice", "severity": "info", "timestamp": "2021-03-17T05:26:11.544527Z"}
Finally you are ready to start instrumenting your application with OpenTelemetry for distributed tracing of the services.
Summary
In this step, you have prepared the codelab material in your environment and confirmed skaffold runs as expected.
Next up
In next step, you will modify the source code of loadgen service to instrument the trace information.
4. Instrumentation for HTTP
Concept of trace instrumentation and propagation
Before editing the source code, let me briefly explain how distributed traces works in a simple diagram.

In this example, we instrument the code to export Trace and Span information to Cloud Trace and propagate trace context across the request from the loadgen service to the server service.
Application need to send Trace metadata such as Trace ID and Span ID in order Cloud Trace to assemble all spans that has same Trace ID into one trace. Also the application need to propagate trace contexts (the combination of Trace ID and Span ID of the parent span) on requesting downstream services, so that they can be aware of which trace context they are handling.
OpenTelemetry helps you:
- to generate unique Trace ID and Span ID
- to export Trace ID and Span ID to the backend
- to propagate trace contexts to other services
Instrument first span
Instrument load generator service
Open Cloud Shell Editor by pressing the button  at the top right of the Cloud Shell. Open
 src/loadgen/loadgen.py from the explorer in the left pane and find main function.
src/loadgen/loadgen.py
def main():
    ...
    # start request loop to client service
    logger.info("start client request loop")
    addr = f"http://{target}"
    while True:
        logger.info("start request to client")
        call_client(addr)
        logger.info("end request to client")
        time.sleep(2.0)
In the main function, you see the loop calling the function call_client in it. In the current implementation, the sectoin has 2 log lines that record the beginning and ending of the function call. Now let's instrument Span information to track the latency of the function call.
First, you need to create a Span with a unique Trace ID and Span ID. OpenTelemetry provides handy library for it. Add the following lines to import OpenTelemetry libraries into your code.
 import structlog
+from opentelemetry import propagate, trace
+from opentelemetry.exporter.cloud_trace import CloudTraceSpanExporter
+from opentelemetry.sdk.trace import TracerProvider
+from opentelemetry.instrumentation.requests import RequestsInstrumentor
+from opentelemetry.sdk.trace.export import SimpleSpanProcessor
+from opentelemetry.propagators.cloud_trace_propagator import CloudTraceFormatPropagator
Because the load generator is calling client application in HTTP via requests module, we use the extension package for requests and enable instrumentation.
 from opentelemetry.propagators.cloud_trace_propagator import CloudTraceFormatPropagator
+
+RequestsInstrumentor().instrument()
Then set up Tracer instance that handles the Trace Contenxt and exporter settings
     target = os.environ.get("CLIENT_ADDR", "0.0.0.0:8080")

+    exporter = CloudTraceSpanExporter()
+    trace.get_tracer_provider().add_span_processor(SimpleSpanProcessor(exporter))
+    tracer = trace.get_tracer(__name__)
+    propagate.set_global_textmap(CloudTraceFormatPropagator())
+    trace.set_tracer_provider(TracerProvider())
+
     # connectivity check to client service
     healthz = f"http://{target}/_healthz"
     logger.info(f"check connectivity: {healthz}")
Note that because this is a codelab to understand how trace instrumentation works, we configure the Tracer to record every single request and to send them to the backend. (SimpleSpanProcessor()) This is not fitting to production environments, so be sure to change this part when you instrument your production application.
Now you can instrument Spans with the Tracer. The point here is that what you need to do is to generate a Span explicitly, and that's it! Though there are two lines that add event metadata into Span, you don't need to generate unique Trace ID and Span ID manually and embed them into Span.
     logger.info("start client request loop")
     addr = f"http://{target}"
     while True:
-        logger.info("start request to client")
-        call_client(addr)
-        logger.info("end request to client")
+        with tracer.start_as_current_span("loadgen") as root_span:
+            root_span.add_event(name="request_start")
+            logger.info("start request to client")
+            call_client(addr)
+            root_span.add_event(name="request_end")
+            logger.info("end request to client")
         time.sleep(2.0)
In order for Docker build to fetch the required OpenTelemetry packages, run the following command:
poetry add "opentelemetry-exporter-gcp-trace=^1.0.0rc0"
poetry add "opentelemetry-propagator-gcp=^1.0.0rc0"
poetry add "opentelemetry-instrumentation-requests=^0.20b0"
You can confirm that corresponding dependency description is written in pyproject.toml.
Instrument client service
In the previous section, we instrumented the part enclosed in the red rectangle in the drawing below. We instrumented span information in load generator service. Similarly to the load generator service, now we need to instrument the client service. The difference from the load generator service is that the client service need to extract Trace ID information propagated from the load generator service in the HTTP header and use the ID to generate Spans.

Open Cloud Shell Editor and add required modules like we did for load generator service.
src/client/client.py
 import flask
 import grpc
 import structlog
+from opentelemetry import propagate, trace
+from opentelemetry.exporter.cloud_trace import CloudTraceSpanExporter
+from opentelemetry.instrumentation.flask import FlaskInstrumentor
+from opentelemetry.sdk.trace import TracerProvider
+from opentelemetry.sdk.trace.export import SimpleSpanProcessor
+from opentelemetry.propagators.cloud_trace_propagator import \
+    CloudTraceFormatPropagator

 import shakesapp_pb2
 import shakesapp_pb2_grpc
You notice that you just imported FlaskInstrumentor that enables automatic instrumentation for Flask application on behalf of users to extract HTTP headers to obtain Trace Contexts with a single line of code. OpenTelemetry community provides similar useful integrations with other major libraries. For further information, you can refer to the official documentation.
 app = flask.Flask(__name__)
+FlaskInstrumentor().instrument_app(app)
Before start instrumentation, again, you need to prepare Tracer instance similarly to what we did in load generator service.
 logger.info(f"server address is {SERVER_ADDR}")

+exporter = CloudTraceSpanExporter()
+trace.get_tracer_provider().add_span_processor(SimpleSpanProcessor(exporter))
+propagate.set_global_textmap(CloudTraceFormatPropagator())
+trace.set_tracer_provider(TracerProvider())

 @app.route("/")
 def main_handler():
    ....
Now it's ready to add instrumentation in the handler. Find main_handler() and modify the part that throws gRPC request to server service.
@app.route("/")
def main_handler():
    q, count = random.choice(list(queries.items()))

    # get Tracer
    tracer = trace.get_tracer(__name__)

    with tracer.start_as_current_span("client") as cur_span:
        channel = grpc.insecure_channel(SERVER_ADDR)
        stub = shakesapp_pb2_grpc.ShakespeareServiceStub(channel)
        logger.info(f"request to server with query: {q}")
        cur_span.add_event("server_call_start")
        resp = stub.GetMatchCount(shakesapp_pb2.ShakespeareRequest(query=q))
        cur_span.add_event("server_call_end")
        if count != resp.match_count:
            raise UnexpectedResultError(
                f"The expected count for '{q}' was {count}, but result was {resp.match_count } obtained"
            )
        result = str(resp.match_count)
        logger.info(f"matched count for '{q}' is {result}")
    return result
Similarly to load generator service, add required packages into pyproject.toml by the following command.
poetry add "opentelemetry-exporter-gcp-trace=^1.0.0rc0"
poetry add "opentelemetry-propagator-gcp=^1.0.0rc0"
poetry add "opentelemetry-instrumentation-flask=^0.20b0"
Then try launching the application by skaffold run command and see what the Cloud Trace dashboard shows:
skaffold run --tail
After seeing some build, push and deploy messages, you will see application logs in JSON formats. Navigate yourself to Cloud Trace > Trace list to check whether you get the trace information. Because the load generator service sends requests to client service periodically and you enabled traces for all requests, you start seeing a lot of dots on trace list.

By clicking on one of those, you will see a waterfall graph like below that explains that latency of each part of during the request and response process. Find the checkbox next to "Show Events", then you will get the annotations inside the waterfall graph. These annotations are those you instrumented in the code by span.add_event() method.

You might notice that you don't see the spans from server service. It is correct because we haven't instrumented Spans in server service at all.
Summary
In this step, you have instrumented load generator service and client service and confirmed that you could successfully propagate Trace Context across services and export Span information from both services to Cloud Trace.
Next up
In next step, you will instrument client service and server service to confirm how to propagate Trace Context via gRPC.
5. Instrumentation for gRPC
In the previous step, we instrumented the first half of the request in this microservices. In this step, we try to instrument gRPC communication between client service and server service. (Green and purple rectangle in the picture below)

Automatic instrumentation for gRPC client
OpenTelemetry's ecosystem offers a lot of handy libraries that helps developers to instrument applications. In previous step, we used automatic instrumentation for "requests" module. In this step, as we are trying to propagate Trace Context through gRPC, we use the library for it.
src/client/client.py
 import flask
 import grpc
 import structlog
 from opentelemetry import propagate, trace
 from opentelemetry.exporter.cloud_trace import CloudTraceSpanExporter
 from opentelemetry.instrumentation.flask import FlaskInstrumentor
+from opentelemetry.instrumentation.grpc import GrpcInstrumentorClient
 from opentelemetry.sdk.trace import TracerProvider
 from opentelemetry.sdk.trace.export import SimpleSpanProcessor
 from opentelemetry.propagators.cloud_trace_propagator import \
     CloudTraceFormatPropagator
 import shakesapp_pb2
 import shakesapp_pb2_grpc


 app = flask.Flask(__name__)
 FlaskInstrumentor().instrument_app(app)
+GrpcInstrumentorClient().instrument()
For client service, what we need to do for the instrumentation is pretty small. What we want to do is to propagate the Trace Context, which is the combination of Trace ID and Span ID of current Span via gRPC. So we call GrpcInstrumentatorClient.instrument() so that gRPC client in the hander function can embed the Trace Context into the HTTP header underneath.
Make sure to add new dependencies to pyproject.toml with poetry add command:
poetry add "opentelemetry-instrumentation-grpc=^0.20b0"
Automatic instrumentation for gRPC server
Like what we did for gRPC client, we call automatic instrumentation for gRPC server. Add imports like followings and call GrpcInstrumentationServer().instrument() at the top of the file.
Caution: Make sure to call
GrpcInstrumentationServe()
in this step, not
GrpcInstrumentationClient()
.
src/server/server.py
 import grpc
 import structlog
 from google.cloud import storage
 from grpc_health.v1 import health_pb2, health_pb2_grpc
+from opentelemetry import propagate, trace
+from opentelemetry.exporter.cloud_trace import CloudTraceSpanExporter
+from opentelemetry.instrumentation.grpc import GrpcInstrumentorServer
+from opentelemetry.sdk.trace import TracerProvider
+from opentelemetry.sdk.trace.export import SimpleSpanProcessor
+from opentelemetry.propagators.cloud_trace_propagator import CloudTraceFormatPropagator

 import shakesapp_pb2
 import shakesapp_pb2_grpc


 BUCKET_NAME = "dataflow-samples"
 BUCKET_PREFIX = "shakespeare/"

+# enable auto gRPC server trace instrumentation
+GrpcInstrumentorServer().instrument()
+
And next, you'll add the exporter to send trace information to the Cloud Trace backend. Add the following code in serve() function.
def serve():
+    # start trace exporter
+    trace.set_tracer_provider(TracerProvider())
+    trace.get_tracer_provider().add_span_processor(
+        SimpleSpanProcessor(CloudTraceSpanExporter())
+    )
+    propagators.set_global_textmap(CloudTraceFormatPropagator())
+
+    # add gRPC services to server
     server = grpc.server(futures.ThreadPoolExecutor(max_workers=4))
     service = ShakesappService()
     shakesapp_pb2_grpc.add_ShakespeareServiceServicer_to_server(service, server)
     health_pb2_grpc.add_HealthServicer_to_server(service, server)
Make sure to add newly added packages in the server service.
poetry add "opentelemetry-exporter-gcp-trace=^1.0.0rc0"
poetry add "opentelemetry-instrumentation-grpc=^0.20b0"
poetry add "opentelemetry-propagator-gcp=^1.0.0rc0"
poetry add "opentelemetry-instrumentation=^0.20b0"
Run the microservice and confirm the trace
Then run your modified code with skaffold command.
skaffold run --tail
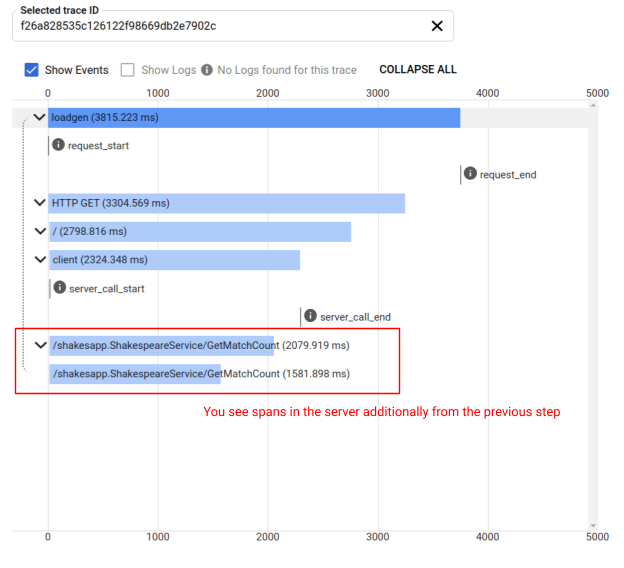
Now again, you see a bunch of traces in the Cloud Trace's Trace list page. Click one of the traces and now you find that spans across the request from load generator service to server service.
Summary
In this step, you instrumented gRPC based communication with the support from the OpenTelemetry ecosystem libraries. Also, you confirmed that the Trace Context generated in the load generator service was successfully delivered to the server service.
6. Congratulations
You have successfully created distributed traces with OpenTelemery and confirmed request latencies across the microservice on Google Cloud Trace.
For extended exercises, you can try the following topics by yourself.
- Current implementation sends all spans generated by health check. How do you filter out those spans from Cloud Traces? Hint is here.
- Correlate event logs with spans and see how it works on Google Cloud Trace and Google Cloud Logging. Hint is here.
- Replace some service with the one in another language and try instrument it with OpenTelemetry for that language
Caution: Google Kubernetes Engine and Google Artifact Registry consume the resource constantly.
Clean up
After this codelab, please stop the Kubernetes cluster and make sure to delete the project so that you don't get unexpected charges on Google Kubernetes Engine, Google Cloud Trace, Google Artifact Registry.
First, delete the cluster with the following command:
skaffold delete
Command output
Cleaning up...
 - deployment.apps "clientservice" deleted
 - service "clientservice" deleted
 - deployment.apps "loadgen" deleted
 - deployment.apps "serverservice" deleted
 - service "serverservice" deleted
After deleting the cluster, from the menu pane, select "IAM & Admin" > "Settings", and then click "SHUT DOWN" button.

Then enter the Project ID (not Project Name) in the form in the dialog and confirm shutdown.